

-
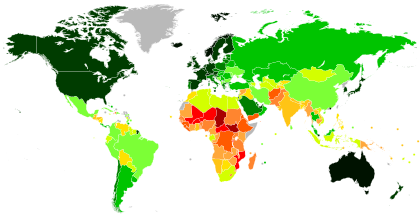
Very high (≥ 0.800)
-
High (0.700–0.799)
-
Medium (0.550–0.699)
-
Low (≤ 0.549)
-
Data unavailable
-
≥ 0.950
-
0.900–0.950
-
0.850–0.899
-
0.800–0.849
-
0.750–0.799
-
0.700–0.749
-
0.650–0.699
-
0.600–0.649
-
0.550–0.599
-
0.500–0.549
-
0.450–0.499
-
0.400–0.449
-
≤ 0.399
-
Data unavailable
The United Nations Development Programme (UNDP) compiles the Human Development Index (HDI) of 191 nations in the annual Human Development Report. The index considers the health, education, income and living in a given country to provide a measure of human development which is comparable between countries and over time.
The HDI is the most widely used indicator of human development and has changed how people view the concept. However, several aspects of the index have received criticism. Some scholars have criticized how the factors are weighed, in particular how an additional year of life expectancy is valued differently between countries; and the limited factors it considers, noting the omission of factors such as the levels of distributional and gender inequality. In response to the former, the UNDP introduced the inequality-adjusted Human Development Index (IHDI) in its 2010 report, and in response to the latter the Gender Development Index (GDI) was introduced in the 1995 report. Others have criticized the perceived oversimplification of using a single number per country. To reflect developmental differences within countries, a subnational HDI (SHDI) featuring data for more than 1,600 regions was introduced in 2018 by the Global Data Lab at Radboud University in the Netherlands. In 2020, the UNDP introduced another index, the planetary pressures–adjusted Human Development Index (PHDI), which decreases the scores of countries with a higher ecological footprint.
Dimensions and indicators
The HDI was first published in 1990 with the goal of being a more comprehensive measure of human development than purely economic measures such as gross domestic product. The index incorporates three dimensions of human development: a long and healthy life, knowledge, and decent living standards. Various indicators are used to quantify how countries perform on each dimension. The indicators used in the 2022 report were life expectancy at birth; expected years of schooling for children; mean years of schooling for adults; and gross national income per capita. The indicators are used to create a health index, an education index and an income index, each with a value between 0 and 1. The geometric mean of the three indices—that is, the cube root of the product of the indices—is the human development index. A value above 0.800 is classified as very high, between 0.700 and 0.799 as high, 0.550 to 0.699 as medium, and below 0.550 as low.
The data used to calculate HDI comes mostly from United Nations agencies and international institutions, such as United Nations Educational, Scientific and Cultural Organization (UNESCO), United Nations Department of Economic and Social Affairs, the World Bank, International Monetary Fund and Organisation for Economic Co-operation and Development (OECD). Rarely, when one of the indicators is missing, cross-country regression models are used. Due to improved data and methodology updates, HDI values are not comparable across human development reports; instead, each report recalculates the HDI for some previous years.
| Dimensions | Indicators | Dimension index | HDI |
|---|---|---|---|
| Long and healthy life | Life expectancy at birth | Life expectancy index | Human Development Index |
| Knowledge | Expected years of schooling Mean years of schooling |
Education index | |
| A decent standard of living | GNI per capita (PPP $) | GNI index |
Nations

The Human Development Report includes all 193United Nations member states, as well as the State of Palestine and Hong Kong SAR. However, the Human Development Index is not calculated for four of the UN member states: DPR Korea (North Korea), Monaco, Nauru, and Somalia. Some components of the index may be calculated for these countries. The Cook Islands, the Holy See (Vatican City), and Niue are the only state parties within the United Nations System that are not included in the report. In total, the HDI is available for 191 nations.
Global Data Lab also provides data on the HDI of Somalia, putting it at 0.361 (2019), the lowest in the world.
Countries ranked from 1 to 66 in 2021 are designated "very high" HDI; those ranked from 67 to 115 are designated "high" HDI; those ranked from 116 to 159 are denoted "medium" HDI; and those ranked from 160 to 191 are designated "low" HDI.
| Rank | Nation | HDI | ||
|---|---|---|---|---|
| 2021 data (2022 report) | Change since 2015 | 2021 data (2022 report) | Average annual growth (2010–2021) | |
| 1 |
|
|
0.962 |
|
| 2 |
|
|
0.961 |
|
| 3 |
|
|
0.959 |
|
| 4 |
|
|
0.952 |
|
| 5 |
|
|
0.951 |
|
| 6 |
|
|
0.948 |
|
| 7 |
|
|
0.947 |
|
| 8 |
|
|
0.945 |
|
| 9 |
|
|
0.942 |
|
| 10 |
|
|
0.941 |
|
| 11 |
|
|
0.940 |
|
| 12 |
|
|
0.939 |
|
| 13 |
|
|
0.937 |
|
|
|
|
|
||
| 15 |
|
|
0.936 |
|
| 16 |
|
|
0.935 |
|
| 17 |
|
|
0.930 |
|
| 18 |
|
|
0.929 |
|
| 19 |
|
|
0.925 |
|
|
|
|
|
||
| 21 |
|
|
0.921 |
|
| 22 |
|
|
0.919 |
|
| 23 |
|
|
0.918 |
|
|
|
|
|
||
| 25 |
|
|
0.916 |
|
| 26 |
|
|
0.911 |
|
| 27 |
|
|
0.905 |
|
| 28 |
|
|
0.903 |
|
| 29 |
|
|
0.896 |
|
| 30 |
|
|
0.895 |
|
| 31 |
|
|
0.890 |
|
| 32 |
|
|
0.889 |
|
| 33 |
|
|
0.887 |
|
| 34 |
|
|
0.876 |
|
| 35 |
|
|
0.875 |
|
|
|
|
|
||
|
|
|
|
||
| 38 |
|
|
0.866 |
|
| 39 |
|
|
0.863 |
|
| 40 |
|
|
0.858 |
|
|
|
|
|
||
| 42 |
|
|
0.855 |
|
|
|
|
|
||
| 44 | NA |
|
0.853 | NA |
| 45 |
|
|
0.848 |
|
| 46 |
|
|
0.846 |
|
| 47 |
|
|
0.842 |
|
| 48 |
|
|
0.838 |
|
| 49 |
|
|
0.832 |
|
| 50 |
|
|
0.831 |
|
| 51 |
|
|
0.829 |
|
| 52 |
|
|
0.822 |
|
| 53 |
|
|
0.821 |
|
| 54 |
|
|
0.816 |
|
| 55 |
|
|
0.812 |
|
| 56 |
|
|
0.811 |
|
| 57 |
|
|
0.810 |
|
| 58 |
|
|
0.809 |
|
|
|
|
|
||
| 60 |
|
|
0.808 |
|
| 61 |
|
|
0.805 |
|
| 62 |
|
|
0.803 |
|
| 63 |
|
|
0.802 |
|
|
|
|
|
||
|
|
|
|
||
| 66 |
|
|
0.800 |
|
| 67 |
|
|
0.796 |
|
| 68 |
|
|
0.795 |
|
|
|
|
|
||
| 70 |
|
|
0.790 |
|
| 71 |
|
|
0.788 |
|
| 72 |
|
|
0.785 |
|
| 73 |
|
|
0.782 |
|
| 74 |
|
|
0.780 |
|
| 75 |
|
|
0.777 |
|
| 76 |
|
|
0.774 |
|
| 77 |
|
|
0.773 |
|
| 78 |
|
|
0.770 |
|
| 79 |
|
|
0.768 |
|
| 80 |
|
|
0.767 |
|
|
|
|
|
||
|
|
|
|
||
| 83 |
|
|
0.764 |
|
| 84 |
|
|
0.762 |
|
| 85 |
|
|
0.759 |
|
| 86 |
|
|
0.758 |
|
| 87 |
|
|
0.754 |
|
| 88 |
|
|
0.752 |
|
| 89 |
|
|
0.751 |
|
| 90 |
|
|
0.747 |
|
| 91 |
|
|
0.745 |
|
|
|
|
|
||
|
|
|
|
||
|
|
|
|
||
| 95 |
|
|
0.740 |
|
| 96 |
|
|
0.739 |
|
| 97 |
|
|
0.731 |
|
|
|
|
|
||
| 99 |
|
|
0.730 |
|
|
|
|
|
||
| 101 |
|
|
0.727 |
|
| 102 |
|
|
0.720 |
|
|
|
|
|
||
| 104 |
|
|
0.718 |
|
| 105 |
|
|
0.717 |
|
| 106 |
|
|
0.715 |
|
|
|
|
|
||
| 108 |
|
|
0.714 |
|
| 109 |
|
|
0.713 |
|
| 110 |
|
|
0.709 |
|
| 111 |
|
|
0.707 |
|
| 112 |
|
|
0.706 |
|
|
|
|
|
||
| 114 |
|
|
0.705 |
|
| 115 |
|
|
0.703 |
|
| 116 |
|
|
0.699 |
|
| 117 |
|
|
0.693 |
|
| 118 |
|
|
0.692 |
|
|
|
|
|
||
| 120 |
|
|
0.691 |
|
| 121 |
|
|
0.686 |
|
| 122 |
|
|
0.685 |
|
| 123 |
|
|
0.683 |
|
|
|
|
|
||
| 125 |
|
|
0.675 |
|
| 126 |
|
|
0.667 |
|
| 127 |
|
|
0.666 |
|
| 128 |
|
|
0.662 |
|
| 129 |
|
|
0.661 |
|
| 130 |
|
|
0.641 |
|
| 131 |
|
|
0.639 | NA |
| 132 |
|
|
0.633 |
|
| 133 |
|
|
0.632 |
|
| 134 |
|
|
0.628 |
|
| 135 |
|
|
0.627 |
|
| 136 |
|
|
0.624 |
|
| 137 |
|
|
0.621 |
|
| 138 |
|
|
0.618 |
|
| 139 |
|
|
0.615 |
|
| 140 |
|
|
0.607 |
|
|
|
|
|
||
|
|
|
|
||
| 143 |
|
|
0.602 |
|
| 144 |
|
|
0.597 |
|
| 145 |
|
|
0.596 |
|
| 146 |
|
|
0.593 |
|
|
|
|
|
||
| 148 |
|
|
0.586 |
|
| 149 |
|
|
0.585 |
|
| 150 |
|
|
0.577 |
|
| 151 |
|
|
0.576 |
|
| 152 |
|
|
0.575 |
|
| 153 |
|
|
0.571 |
|
| 154 |
|
|
0.565 |
|
| 155 |
|
|
0.564 |
|
| 156 |
|
|
0.558 |
|
|
|
|
|
||
| 158 |
|
|
0.556 |
|
| 159 |
|
|
0.550 |
|
| 160 |
|
|
0.549 |
|
| 161 |
|
|
0.544 |
|
| 162 |
|
|
0.539 |
|
| 163 |
|
|
0.535 |
|
|
|
|
|
||
| 165 |
|
|
0.534 |
|
| 166 |
|
|
0.525 |
|
|
|
|
|
||
| 168 |
|
|
0.514 |
|
| 169 |
|
|
0.512 |
|
| 170 |
|
|
0.511 |
|
| 171 |
|
|
0.509 |
|
| 172 |
|
|
0.508 |
|
| 173 |
|
|
0.501 |
|
| 174 |
|
|
0.500 |
|
| 175 |
|
|
0.498 |
|
| 176 |
|
|
0.492 |
|
| 177 |
|
|
0.483 |
|
| 178 |
|
|
0.481 |
|
| 179 |
|
|
0.479 |
|
| 180 |
|
|
0.478 |
|
| 181 |
|
|
0.477 |
|
| 182 |
|
|
0.465 |
|
| 183 |
|
|
0.455 |
|
| 184 |
|
|
0.449 |
|
| 185 |
|
|
0.446 |
|
| 186 |
|
|
0.428 |
|
| 187 |
|
|
0.426 |
|
| 188 |
|
|
0.404 |
|
| 189 |
|
|
0.400 |
|
| 190 |
|
|
0.394 |
|
| 191 |
|
|
0.385 |
|
Regions and groups
The Human Development Report also reports the HDI for various groups of countries. These include regional groupings based on the UNDP regional classifications, HDI groups including the countries currently falling into a given HDI bracket, OECD members and various other UN groupings. The aggregate HDI values are calculated in the same way as for individual countries with the input data being the weighted average for all countries with available data in the group.
| Region or group | 1990 | 2000 | 2010 | 2015 | 2018 | 2019 | 2020 | 2021 |
|---|---|---|---|---|---|---|---|---|
| OECD | 0.795 | 0.840 | 0.875 | 0.893 | 0.901 | 0.905 | 0.897 | 0.899 |
| Very high human development | 0.784 | 0.826 | 0.868 | 0.889 | 0.898 | 0.902 | 0.895 | 0.896 |
| Europe and Central Asia | 0.664 | 0.681 | 0.746 | 0.783 | 0.798 | 0.802 | 0.793 | 0.796 |
| Latin America and the Caribbean | 0.633 | 0.689 | 0.733 | 0.758 | 0.766 | 0.768 | 0.755 | 0.754 |
| High human development | 0.557 | 0.625 | 0.700 | 0.734 | 0.751 | 0.756 | 0.753 | 0.754 |
| East Asia and the Pacific | 0.507 | 0.592 | 0.684 | 0.722 | 0.741 | 0.748 | 0.748 | 0.749 |
| World | 0.601 | 0.645 | 0.697 | 0.724 | 0.736 | 0.739 | 0.735 | 0.732 |
| Small Island Developing States | 0.601 | 0.649 | 0.693 | 0.723 | 0.734 | 0.738 | 0.732 | 0.730 |
| Arab states | 0.555 | 0.618 | 0.676 | 0.697 | 0.711 | 0.715 | 0.708 | 0.708 |
| Developing countries | 0.513 | 0.569 | 0.638 | 0.673 | 0.687 | 0.691 | 0.687 | 0.685 |
| Medium human development | 0.453 | 0.506 | 0.582 | 0.627 | 0.643 | 0.645 | 0.642 | 0.636 |
| South Asia | 0.442 | 0.500 | 0.576 | 0.623 | 0.640 | 0.641 | 0.638 | 0.632 |
| Sub-Saharan Africa | 0.407 | 0.430 | 0.503 | 0.534 | 0.547 | 0.552 | 0.549 | 0.547 |
| Least developed countries | 0.357 | 0.408 | 0.487 | 0.520 | 0.537 | 0.542 | 0.542 | 0.540 |
| Low human development | 0.356 | 0.399 | 0.477 | 0.506 | 0.518 | 0.522 | 0.519 | 0.518 |
See also
- List of countries by Human Development Index by region
- List of countries by inequality-adjusted Human Development Index
- List of countries by planetary pressures–adjusted Human Development Index
External links
|
Economic classification of countries
| |||||
|---|---|---|---|---|---|
| Three-World Model | |||||
| Gross domestic product (GDP) |
|
||||
| Gross national income (GNI) | |||||
| Wages | |||||
| Wealth | |||||
| Other national accounts | |||||
| Human development | |||||
| Digital divide | |||||
|
Net international investment position (NIIP) |
|||||