GFP-cDNA
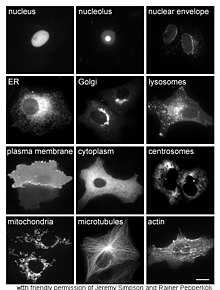
The GFP-cDNA project documents the localisation of proteins to subcellular compartments of the eukaryotic cell applying fluorescence microscopy. Experimental data are complemented with bioinformatic analyses and published online in a database. A search function allows the finding of proteins containing features or motifs of particular interest. The project is a collaboration of the research groups of Rainer Pepperkok at the European Molecular Biology Laboratory (EMBL) and Stefan Wiemann at the German Cancer Research Centre (DKFZ).
What kinds of experiments are made?
The cDNAs of novel identified Open Reading Frames(ORF) are tagged with Green Fluorescent Protein (GFP) and expressed in eukaryotic cells. Subsequently, the subcellular localisation of the fusion proteins is recorded by fluorescence microscopy.
Steps:
1. Large-scale cloning
Any large-scale manipulation of ORFs requires cloning technologies which are free of restriction enzymes. In this respect those that utilise recombination cloning (Gateway of Invitrogen or Creator of BD Biosciences) have proved to be the most suitable. This cloning technology is based on recombination mechanisms used by phages to integrate their DNA into the host genome. It allows the ORFs to be rapidly and conveniently shuttled between functionally useful vectors without the need for conventional restriction cloning. In the cDNA-GFP project the ORFs are transferred into CFP/YFP expression vectors. For the localisation analysis both N- and C-terminal fusions are generated. This maximises the possibility of correctly ascertaining the localisation, since the presence of GFP may mask targeting signals that may be present at one end of the native protein.
N-Terminal Fluorescent Fusions
Insert your gene of interest into the MCS upstream of the fluorescent protein gene, and express your gene as a fusion to the N-terminus of the fluorescent protein.
C-Terminal Fluorescent Fusions
Insert your gene of interest into the MCS downstream of the fluorescent protein gene, and express your gene as a fusion to the C-terminus of the fluorescent protein.
2. Transfection of eukaryotic cells, Expression
The fusion vectors are transfected in Vero cells (monkey kidney fibroblasts). Particularly interesting ORFs are also screened for localisation in PC12 cells and hippocampal neurons.
3. Protein localisation
At different time points, the subcellular localisation of the fusion proteins is recorded via fluorescence microscopy. At the end of the live cell imaging, the cells can still be fixed and colocalisation experiments made.
4. Bioinformatic Analysis
As the sequence of the cDNAs is known, bioinformatics can make predictions regarding the localisation and function of the encoded protein. The bioinformatics analysis is facilitated by the bioinformatic search engine Harvester.
5. Assignment of subcellular localization category
Results from the N- and C-terminal fusions are assessed and in turn these data are compared to the bioinformatic predictions. A final subcellular localisation (from approximately 20 categories) is then assigned for each ORF. Similar localisations with both N- and C-terminal constructs provide a higher degree of reliability of the result. For those ORFs where the two fusions do not give a similar localisation pattern, a series of other criteria, including bioinformatic predictions, are considered. Occasionally a clear cut localization cannot be assigned.
Which data is published?
Every data sheet contains the fluorescence images of both N- and C-terminal fusions, the assigned localization, other localizations, comments and the Swissprot ID. For every protein entry, a link is provided to the corresponding Harvester bioinformatics page.
How do I use the GFP-cDNA database?
Images of all localised proteins and their bioinformatic analysis can be viewed via the ‘Results Table’ or ‘Results Images’ buttons. In addition, use the search window on the entry site to find proteins containing features or motifs of particular interest to you that have been localised in this project.

