


| This article is part of a series on |
| Income in the United States of America |
|---|
 |
|
|
Household income is an economic standard that can be applied to one household, or aggregated across a large group such as a county, city, or the whole country. It is commonly used by the United States government and private institutions to describe a household's economic status or to track economic trends in the US.
A key measure of household income is the median income, at which half of households have income above that level and half below. The U.S. Census Bureau reports two median household income estimates based on data from two surveys: the Current Population Survey (CPS) and the American Community Survey (ACS). The CPS is the recommended source for national-level estimates, whereas the ACS gives estimates for many geographic levels. According to the CPS, the median household income was $63,179 in 2018. According to the ACS, the U.S. median household income in 2018 was $61,937. Estimates for previous years are given in terms of real income, which have been adjusted for changes to the price of goods and services.
The distribution of U.S. household income has become more unequal since around 1980, with the income share received by the top 1% trending upward from around 10% or less over the 1953–1981 period to over 20% by 2007. After falling somewhat due to the Great Recession in 2008 and 2009, inequality rose again during the economic recovery, a typical pattern historically.
Definition
A household's income can be calculated in various ways but the US Census as of 2009 measured it in the following manner: the income of every resident of that house that is over the age of 15, including pre-tax wages and salaries, along with any pre-tax personal business, investment, or other recurring sources of income, as well as any kind of governmental entitlement such as unemployment insurance, social security, disability payments or child support payments received.
The residents of the household do not have to be related to the head of the household for their earnings to be considered part of the household's income. As households tend to share a similar economic context, the use of household income remains among the most widely accepted measures of income. That the size of a household is not commonly taken into account in such measures may distort any analysis of fluctuations within or among the household income categories, and may render direct comparisons between quintiles difficult or even impossible. The US Census does not include noncash benefits such as health benefits.
Recent trends

The Current Population Survey of the U.S. Census Bureau reported in September 2017 that real median household income was $59,039 in 2016, exceeding any previous year. This was the fourth consecutive year with a statistically significant increase by their measure.
Changes in median income reflect several trends: the aging of the population, changing patterns in work and schooling, and the evolving makeup of the American family, as well as long- and short-term trends in the economy itself. For instance, the retirement of the Baby Boom generation should push down overall median income, as more persons enter lower-income retirement. However, analysis of different working age groups indicate a similar pattern of stagnating median income as well.
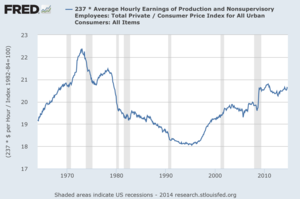
Journalist Annie Lowrey wrote in September 2014: "The root causes [of wage stagnation] include technological change, the decline of labor unions, and globalization, economists think, though they disagree sharply on how much to weight each factor. But foreign-produced goods became sharply cheaper, meaning imports climbed and production moved overseas. And computers took over for humans in many manufacturing, clerical, and administrative tasks, eroding middle-class jobs growth and suppressing wages."
Another line of analysis, known as "total compensation," presents a more complete picture of real wages. The Kaiser Family Foundation conducted a study in 2013 which shows that employer contributions to employee healthcare costs went up 78% from 2003 to 2013. The marketplace has made a trade-off: expanding benefits packages vs. increasing wages.
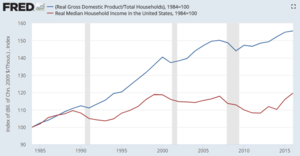
Measured relative to GDP, total compensation and its component wages and salaries have been declining since 1970. This indicates a shift in income from labor (persons who derive income from hourly wages and salaries) to capital (persons who derive income via ownership of businesses, land and assets). This trend is common across the developed world, due in part to globalization. Wages and salaries have fallen from approximately 51% GDP in 1970 to 43% GDP in 2013. Total compensation has fallen from approximately 58% GDP in 1970 to 53% GDP in 2013.
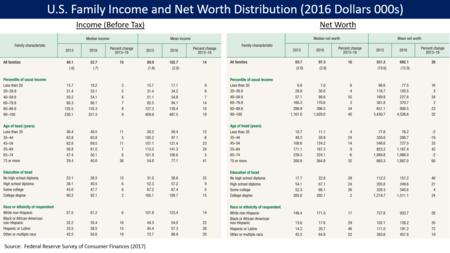
However, as indicated by the charts below, household income has still increased significantly since the late 1970s and early 80s in real terms, partly due to higher individual median wages, and partly due to increased employment of women.
According to the CBO, between 1979 and 2011, gross median household income, adjusted for inflation, rose from $59,400 to $75,200, or 26.5%. However, once adjusted for household size and looking at taxes from an after-tax perspective, real median household income grew 46%, representing significant growth.
The following table summarizes real median household income at key recent milestones:
| Variable | 1999 Previous Record | 2007 Pre-Crisis Peak | 2012 Post-Crisis Trough | 2016 Previous Record | 2017 Previous Record | 2018 Record |
|---|---|---|---|---|---|---|
| Real median household income | $61,526 | $60,985 | $55,900 | $61,779 | $62,626 | $63,179 |
Uses
Use of individual household income: The government and organizations may look at one particular household's income to decide if a person is eligible for certain programs, such as nutrition assistance or need-based financial aid, among many others.
Use at the aggregate level: Summaries of household incomes across groups of people – often the entire country – are also studied as part of economic trends like standard of living and distribution of income and wealth. Household income as an economic measure can be represented as a median, a mean, a distribution, and other ways. Household income can be studied across time, region, education level, race/ethnicity, and many other dimensions. As an indicator of economic trends, it may be studied along with related economic measures such as disposable income, debt, household net worth (which includes debt and investments, durable goods like cars and houses), wealth, and employment statistics.
Median inflation-adjusted ("real") household income
Median inflation-adjusted ("real") household income generally increases and decreases with the business cycle, declining in each year during the periods 1979 through 1983, 1990 through 1993, 2000 through 2004 and 2008 through 2012, while rising in each of the intervening years.Extreme poverty in the United States, meaning households living on less than $2 per person per day before government benefits, more than doubled in absolute terms from 636,000 to 1.46 million households (including 2.8 million children) between 1996 and 2011, with most of this increase occurring between late 2008 and early 2011.

CBO income growth study
The nonpartisan Congressional Budget Office conducted a study analyzing household income throughout the income distribution, by combining the Census and IRS income data sources. Unlike the Census measure of household income, the CBO showed income before and after taxes, and by also taking into account household size. Also, the CBO definition of income is much broader, and includes in kind transfers as well as all monetary transfers from the government. The Census' official definition of money income excludes food stamps and the EITC, for example, while CBO includes it.
Between 1979 and 2011, gross median household income, adjusted for inflation, rose from $59,400 to $75,200, or 26.5%. This compares with the Census' growth of 10%. However, once adjusted for household size and looking at taxes from an after-tax perspective, real median household income grew 46%, representing significant growth.
While median gross household income showed much stronger growth than depicted by the Census, inequality was shown to still have increased. The top 10% saw gross household income grow by 78%, versus 26.5% for the median. The bottom 10%, using the same measure, saw higher growth than the median (40%).
Since 1980, U.S. gross domestic product (GDP) per capita has increased 67%, while median household income has only increased by 15%. Median household income is a politically sensitive indicator. Voters can be critical of their government if they perceive that their cost of living is rising faster than their income.
The early-2000s recession began with the bursting of the dot-com bubble and affected most advanced economies including the European Union, Japan and the United States. An economic recession will normally cause household incomes to decrease, often by as much as 10%.
The late-2000s recession began with the bursting of the U.S. housing bubble, which caused a problem in the dangerously exposed sub prime-mortgage market. This in turn triggered a global financial crisis. In constant price, 2011 American median household income was 1.13% lower than what it was in 1989. This corresponds to a 0.05% annual decrease over a 22-year period. In the meantime, GDP per capita has increased by 33.8% or 1.33% annually.
A study on US Census income data claims that when using the national accounting methodology, U.S. gross median household income was $57,739 in 2010 (table 3).
In 2015, the US median household income spiked 5.2 per cent, reaching $56,000, making it the first annual hike in median household income since the start of the Great Recession.
Mean household income
Another common measurement of personal income is the mean household income. Unlike the median household income, which divides all households in two halves, the mean income is the average income earned by American households. In the case of mean income, the income of all households is divided by the number of all households. The mean income is more affected by the relatively unequal distribution of income which tilts towards the top. As a result, the mean income in the United States is higher than the median income, with the top earning households boosting it. Overall, the mean household income in the United States, according to the US Census Bureau 2014 Annual Social and Economic Supplement, was $72,641.
The U.S. Census Bureau provides the following breakdown by self-identified ethnic groups as of March 2018:
| Ethnic category | Mean household income |
|---|---|
| Asian alone | $119,816 |
| White alone | $93,948 |
| Hispanic or Latino | $70,945 |
| Black | $59,363 |
Mean vs. median household income
Median income is the amount which divides the income distribution into two equal groups, half having income above that amount, and half having income below that amount. Mean income (average) is the amount obtained by dividing the total aggregate income of a group by the number of units in that group. The means and medians for households and families are based on all households and families. Means and medians for people are based on people 15 years old and over with income.
— US Census Bureau, Frequently Asked Question, published by First Gov.
Aggregate income distribution
The aggregate income measures the combined income earned by all persons in a particular income group. In 2018, the total personal income earned in the United States was $17.6 trillion. In 2008, all households in the United States earned roughly $12,442.2 billion. One half, 49.98%, of all income in the US was earned by households with an income over $100,000, the top twenty percent. Over one quarter, 28.5%, of all income was earned by the top 8%, those households earning more than $150,000 a year. The top 3.65%, with incomes over $200,000, earned 17.5%. Households with annual incomes from $50,000 to $75,000, 18.2% of households, earned 16.5% of all income. Households with annual incomes from $50,000 to $95,000, 28.1% of households, earned 28.8% of all income. The bottom 10.3% earned 1.06% of all income.
Household income and demographics
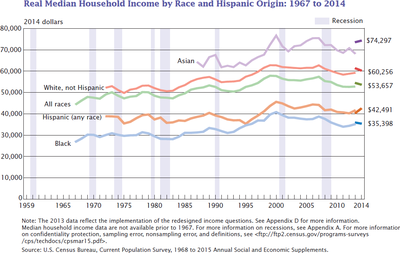
Racial and ethnic groups

White Americans made up roughly 75.1% of all people in 2000, 87.93% of all households in the top 5% were headed by a person who identified as being White alone. Only 4.75% of all household in the top 5% were headed by someone who identified as Hispanic or Latino of any race, versus 12.5% of persons identifying themselves as Hispanic or Latino in the general population.
Overall, 86.01% of all households in the top two quintiles with upper-middle range incomes of over $55,332 were headed by someone identifying as White alone, while 7.21% were being headed by someone who identified as Hispanic and 7.37% by someone who identified as African American or Black. Overall, households headed by Hispanics and African Americans were underrepresented in the top two quintiles and overrepresented in the bottom two quintiles. Households headed by people who identified as being Asian alone were also overrepresented among the top two quintiles. In the top five percent the percentage of Asians was nearly twice as high as the percentage of Asians among the general population. Whites were relatively even distributed throughout the quintiles only being underrepresented in the lowest quintile and slightly overrepresented in the top quintile and the top five percent.
In terms of race in 2004(!) data, Asian-American households had the highest median household income of $57,518, European-American households ranked second with $48,977, Hispanic or Latino households ranked third with $34,241. African-American or Black households had the lowest median household income of all races with $30,134.
Note: This data is roughly 20 years old. Use with care.
| Ethnic group | All households | Lowest fifth | Second fifth | Middle fifth | Fourth fifth | Highest fifth | Top 5% | |
|---|---|---|---|---|---|---|---|---|
| White alone | Number in 1000s | 92,702 | 16,940 | 18,424 | 18,978 | 19,215 | 19,721 | 5,029 |
| Percentage | 81.93% | 74.87% | 81.42% | 83.87% | 84.92% | 87.16% | 87.93% | |
| Asian alone | Number in 1000s | 4,140 | 624 | 593 | 786 | 871 | 1,265 | 366 |
| Percentage | 3.65% | 2.76% | 2.26% | 3.47% | 3.84% | 5.59% | 6.46% | |
| Black | Number in 1000s | 13,792 | 4,474 | 3,339 | 2,637 | 2,053 | 1,287 | 236 |
| Percentage | 12.19% | 19.77% | 14.75% | 11.65% | 9.07% | 5.69% | 4.17% | |
| Hispanic or Latino (of any race) |
Number in 1000s | 12,838 | 3,023 | 3,130 | 2,863 | 1,931 | 1,204 | 269 |
| Percentage | 11.33% | 13.56% | 13.83% | 12.20% | 8.53% | 5.89% | 4.75% | |
Source: US Census Bureau, 2004
Education and gender
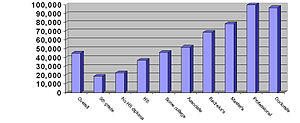
Household income as well as per capita income in the United States rise significantly as the educational attainment increases. In 2005 graduates with a Master's in Business Administration (MBA) who accepted job offers were expected to earn a base salary of $88,626. They were also expected to receive an "average signing bonus of $17,428."
According to the US Census Bureau persons with doctorates in the United States had an average income of roughly $81,400. The average for an advanced degree was $72,824, with men averaging $90,761 and women averaging $50,756 annually. Year-round full-time workers with a professional degree had an average income of $109,600 while those with a master's degree had an average income of $62,300. Overall, "…[a]verage earnings ranged from $18,900 for high school dropouts to $25,900 for high school graduates, $45,400 for college graduates and $99,300 for workers with professional degrees (M.D., O.D., D.P.T., D.P.M., D.O., J.D., Pharm.D., D.D.S., or D.V.M.)."
Individuals with graduate degrees have an average per capita income exceeding the median household income of married couple families among the general population ($63,813 annually). Higher educational attainment did not, however, help close the income gap between the genders as the life-time earnings for a male with a professional degree were roughly forty percent (39.59%) higher than those of a female with a professional degree. The lifetime earnings gap between males and females was the smallest for those individuals holding an associate degrees with male life-time earnings being 27.77% higher than those of females. While educational attainment did not help reduce the income inequality between men and women, it did increase the earnings potential of individuals of both sexes, enabling many households with one or more graduate degree householders to enter the top household income quintile. These data were not adjusted for preferential differences among men and women whom attend college.
Household income also increased significantly with the educational attainment of the householder. The US Census Bureau publishes educational attainment and income data for all households with a householder who was aged twenty-five or older. The biggest income difference was between those with some college education and those who had a Bachelor's degree, with the latter making $23,874 more annually. Income also increased substantially with increased post-secondary education. While the median annual household income for a household with a householder having an associate degree was $51,970, the median annual household income for householders with a bachelor's degree or higher was $73,446. Those with doctorates had the second highest median household with a median of $96,830; $18,289 more than that for those at the master's degree level, but $3,170 lower than the median for households with a professional degree holding householder.
Distribution of household income by educational attainment and gender in 2019 according to US Census data
| Criteria | Overall | Less than 9th grade | Some high school | High school graduate or equivalent | Some college | Associate degree | Bachelor's degree | Bachelor's degree or more | Master's degree | Professional degree | Doctoral degree | |
|---|---|---|---|---|---|---|---|---|---|---|---|---|
| Median annual individual income | Male, age 25+ | $52,297 | $29,405 | $32,112 | $41,580 | $49,676 | $53,082 | $70,968 | $78,156 | $89,915 | $135,970 | $112,305 |
| Female, age 25+ | $40,294 | $20,252 | $21,851 | $28,166 | $32,679 | $35,970 | $50,691 | $56,047 | $61,861 | $88,301 | $87,394 | |
| Age 25+ | $46,985 | $25,162 | $26,092 | $35,540 | $39,362 | $42,391 | $60,705 | $66,432 | $71,851 | $102,741 | $101,526 | |
| Median annual household income | $70,308 | $30,355 | $31,326 | $48,708 | $61,911 | $69,573 | $100,164 | $108,646 | $117,439 | $162,127 | $142,347 | |
The change in median personal and household since 1991 also varied greatly with educational attainment. The following table shows the median household income according to the educational attainment of the householder. All data is in 2003 dollars and only applies to householders whose householder is aged twenty-five or older. The highest and lowest points of the median household income are presented in bold face. Since 2003, median income has continued to rise for the nation as a whole, with the biggest gains going to those with associate degrees, bachelor's degree or more, and master's degrees. High-school dropouts fared worse with negative growth.
| Year | Overall Median | Less than 9th grade | Some high school | High school graduate | Some college | Associate degree | Bachelor's degree | Bachelor's degree or more | Master's degree | Professional degree | Doctoral degree |
|---|---|---|---|---|---|---|---|---|---|---|---|
| 1991 | $40,873 | $17,414 | $23,096 | $37,520 | $46,296 | $52,289 | $64,150 | $68,845 | $72,669 | $102,667 | $92,614 |
| 1993 | $40,324 | $17,450 | $22,523 | $35,979 | $44,153 | $49,622 | $64,537 | $70,349 | $75,645 | $109,900 | $93,712 |
| 1995 | $42,235 | $18,031 | $21,933 | $37,609 | $44,537 | $50,485 | $63,357 | $69,584 | $77,865 | $98,302 | $95,899 |
| 1997 | $43,648 | $17,762 | $22,688 | $38,607 | $45,734 | $51,726 | $67,487 | $72,338 | $77,850 | $105,409 | $99,699 |
| 1999 | $46,236 | $19,008 | $23,977 | $39,322 | $48,588 | $54,282 | $70,925 | $76,958 | $82,097 | $110,383 | $107,217 |
| 2001 | $42,900 | $18,830 | $24,162 | $37,468 | $47,605 | $53,166 | $69,796 | $75,116 | $81,993 | $103,918 | $96,442 |
| 2003 | $45,016 | $18,787 | $22,718 | $36,835 | $45,854 | $56,970 | $68,728 | $73,446 | $78,541 | $100,000 | $96,830 |
| Average | $43,376 | $18,183 | $23,013 | $37,620 | $46,109 | $51,934 | $66,997 | $72,376 | $78,094 | $104,368 | $94,487 |
Source: US Census Bureau, 2003
Age of householder
Household income in the United States varies substantially with the age of the person who heads the household. Overall, the median household income increased with the age of householder until retirement age when household income started to decline. The highest median household income was found among households headed by working baby-boomers.
Households headed by persons between the ages of 45 and 54 had a median household income of $61,111 and a mean household income of $77,634. The median income per member of household for this particular group was $27,924. The highest median income per member of household was among those between the ages of 54 and 64 with $30,544 [The reason this figure is lower than the next group is because pensions and Social Security add to income while a portion of older individuals also have work-related income.].
The group with the second highest median household income, were households headed by persons between the ages 35 and 44 with a median income of $56,785, followed by those in the age group between 55 and 64 with $50,400. Not surprisingly the lowest income group was composed of those households headed by individuals younger than 24, followed by those headed by persons over the age of 75. Overall, households headed by persons above the age of seventy-five had a median household income of $20,467 with the median household income per member of household being $18,645. These figures support the general assumption that median household income as well as the median income per member of household peaked among those households headed by middle aged persons, increasing with the age of the householder and the size of the household until the householder reaches the age of 64. With retirement income replacing salaries and the size of the household declining, the median household income decreases as well.
Household size
While median household income has a tendency to increase up to four persons per household, it declines for households beyond four persons. For example, in the state of Alabama in 2004, two-person households had a median income of $39,755, with $48,957 for three-person households, $54,338 for four-person households, $50,905 for five-person households, $45,435 for six-person households, with seven-or-more-person households having the second lowest median income of only $42,471.
Geography
Considering other racial and geographical differences in regards to household income, it should come as no surprise that the median household income varies with race, size of household and geography. The state with the highest median household income in the United States as of the US Census Bureau 2009 is Maryland with $69,272, followed by New Jersey, Connecticut and Alaska, making the Northeastern United States the wealthiest area by income in the entire country.
Regionally, in 2010, the Northeast reached a median income of $53,283, the West, $53,142, the South, $45,492, and the Midwest, $48,445. Each figure represents a decline from the previous year.
Median household income by state
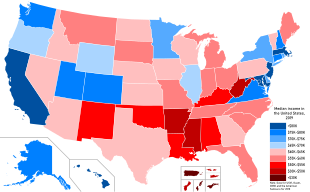
In 2007, the median household income by state ranged from $36,338 in Mississippi to $68,080 in Maryland. Despite having the highest median home price in the nation and home prices that far outpaced incomes,California ranked only eighth in income that year, with a median household income of $59,984. While California's median income was not near enough to afford the average California home or even a starter home, West Virginia, which had one of the nation's lowest median household incomes, also had the nation's lowest median home price.
When grouped by Census Bureau Region, of the 15 states that, in 2017, had the highest median household income, only Minnesota is located in the Mid-West. Five are in the Northeast (Connecticut, Massachusetts, New Hampshire, New Jersey and Rhode Island), three are South Atlantic states (Washington D.C., Maryland and Virginia) while the remaining six are in the West (Alaska, California, Colorado, Hawaii, Washington and Utah).
The southern states had, on average, the lowest median household income, with nine of the country's fifteen poorest states located in the South. However, most of the poverty in the South is located in rural areas. Metropolitan areas such as Atlanta, Nashville, Charlotte, Raleigh, Birmingham, Dallas, Houston, and Miami are areas within the southern states that have above average income levels. Overall, median household income tended to be the highest in the nation's most urbanized northeastern, upper midwestern and west coast states, while rural areas, mostly in the southern and mountain states (like New Mexico, Montana and Idaho), had the lowest median household income.
As of 2019, the median household income ranged from $20,474 in Puerto Rico to $92,266 in the District of Columbia. Note that the U.S. Census Bureau treats Puerto Rico as if it were a state (Puerto Rico is included in the American Community Survey).
All data is from the 2009–2019 American Community Survey 1-Year Estimates.
| Rank | Change* |
State or territory |
2019 | 2018 | 2017 | 2016 | 2015 | 2014 | 2013 | 2012 | 2011 | 2010 | 2009 |
|---|---|---|---|---|---|---|---|---|---|---|---|---|---|
| 1 |
|
District of Columbia | $92,266 | $85,203 | $82,336 | $75,506 | $75,628 | $71,648 | $67,572 | $65,246 | $66,583 | $63,124 | $59,290 |
| 2 |
|
Maryland | $86,738 | $83,242 | $80,776 | $78,945 | $75,847 | $73,971 | $72,483 | $71,836 | $70,004 | $68,854 | $69,272 |
| 3 |
|
Massachusetts | $85,843 | $79,835 | $77,385 | $75,297 | $70,628 | $69,160 | $66,768 | $65,339 | $62,859 | $62,072 | $64,081 |
| 4 |
|
New Jersey | $85,751 | $81,740 | $80,088 | $76,126 | $72,222 | $72,919 | $70,165 | $69,667 | $67,458 | $67,681 | $68,342 |
| 5 | Hawaii | $83,102 | $80,212 | $77,765 | $74,511 | $73,486 | $69,592 | $68,020 | $66,259 | $61,821 | $63,030 | $64,098 | |
| 6 |
|
California | $80,440 | $75,277 | $71,805 | $67,739 | $64,500 | $61,933 | $60,190 | $58,328 | $57,287 | $57,708 | $58,931 |
| 7 |
|
Connecticut | $78,833 | $76,348 | $74,168 | $73,433 | $71,346 | $70,048 | $67,098 | $67,276 | $65,753 | $64,032 | $67,034 |
| 8 |
|
Washington | $78,687 | $74,043 | $70,979 | $67,106 | $64,129 | $61,366 | $58,405 | $57,573 | $56,835 | $55,631 | $56,548 |
| 9 |
|
New Hampshire | $77,933 | $74,991 | $73,381 | $70,936 | $70,303 | $66,532 | $64,230 | $63,280 | $62,647 | $61,042 | $60,567 |
| 10 |
|
Colorado | $77,127 | $71,953 | $69,117 | $65,685 | $63,909 | $61,303 | $58,823 | $56,765 | $55,387 | $54,046 | $55,430 |
| 11 |
|
Virginia | $76,456 | $72,577 | $71,535 | $68,114 | $66,262 | $64,902 | $62,666 | $61,741 | $61,882 | $60,674 | $59,330 |
| 12 |
|
Utah | $75,780 | $71,414 | $68,358 | $65,977 | $62,912 | $60,922 | $59,770 | $57,049 | $55,869 | $54,744 | $55,117 |
| 13 |
|
Alaska | $75,463 | $74,346 | $73,181 | $76,440 | $73,355 | $71,583 | $72,237 | $67,712 | $67,825 | $64,576 | $66,953 |
| 14 |
|
Minnesota | $74,593 | $70,315 | $68,388 | $65,599 | $63,488 | $61,481 | $60,702 | $58,906 | $56,954 | $55,459 | $55,616 |
| 15 |
|
New York | $72,108 | $67,844 | $64,894 | $62,909 | $60,850 | $58,878 | $57,369 | $56,448 | $55,246 | $54,148 | $54,659 |
| 16 |
|
Rhode Island | $71,169 | $64,340 | $63,870 | $60,596 | $58,073 | $54,891 | $55,902 | $54,554 | $53,636 | $52,254 | $54,119 |
| 17 |
|
Delaware | $70,176 | $64,805 | $62,852 | $61,757 | $61,255 | $59,716 | $57,846 | $54,554 | $58,814 | $55,847 | $56,860 |
| 18 | Illinois | $69,187 | $65,030 | $62,992 | $60,960 | $59,588 | $57,444 | $56,210 | $55,137 | $53,234 | $52,972 | $53,966 | |
| 19 |
|
Oregon | $67,058 | $63,246 | $60,212 | $57,532 | $54,148 | $51,075 | $50,251 | $49,161 | $46,816 | $46,560 | $48,457 |
| 20 | Wyoming | $65,003 | $61,584 | $60,434 | $59,882 | $60,214 | $57,055 | $58,752 | $54,901 | $56,322 | $53,512 | $52,664 | |
| 21 |
|
North Dakota | $64,577 | $63,837 | $61,843 | $60,656 | $60,557 | $59,029 | $55,759 | $53,585 | $51,704 | $48,670 | $47,827 |
| 22 | Wisconsin | $64,168 | $60,773 | $59,305 | $56,811 | $55,638 | $52,622 | $51,467 | $51,059 | $50,395 | $49,001 | $49,993 | |
| 23 |
|
Texas | $64,034 | $60,629 | $59,206 | $56,565 | $55,653 | $53,035 | $51,704 | $50,740 | $49,392 | $48,615 | $48,259 |
| 24 | –1 | Pennsylvania | $63,463 | $60,905 | $59,195 | $56,907 | $55,702 | $53,234 | $52,007 | $51,230 | $50,228 | $49,288 | $49,520 |
| 25 |
|
Nevada | $63,276 | $58,646 | $58,003 | $55,180 | $52,431 | $51,450 | $51,230 | $49,760 | $48,927 | $51,001 | $53,341 |
| 26 | Nebraska | $63,229 | $59,566 | $59,970 | $56,927 | $54,996 | $52,686 | $51,440 | $50,723 | $50,296 | $52,504 | $48,408 | |
| 27 |
|
Vermont | $63,001 | $60,782 | $57,513 | $57,677 | $56,990 | $54,166 | $52,578 | $52,997 | $52,776 | $49,406 | $51,618 |
| 28 |
|
Kansas | $62,087 | $58,218 | $56,422 | $54,935 | $53,906 | $52,504 | $50,972 | $50,241 | $48,264 | $48,257 | $47,817 |
| 29 |
|
Arizona | $62,055 | $59,246 | $56,581 | $53,558 | $51,492 | $50,068 | $48,510 | $47,826 | $46,709 | $46,789 | $48,745 |
| 30 |
|
Georgia | $61,980 | $58,756 | $56,183 | $53,559 | $51,244 | $49,321 | $47,829 | $47,209 | $46,007 | $46,430 | $44,736 |
| 31 |
|
Iowa | $61,691 | $59,955 | $58,570 | $56,247 | $54,736 | $53,712 | $52,229 | $50,957 | $49,427 | $47,961 | $48,044 |
| 32 |
|
Idaho | $60,999 | $55,583 | $52,225 | $51,807 | $48,275 | $47,861 | $46,783 | $45,489 | $43,341 | $43,490 | $44,926 |
| 33 |
|
Michigan | $59,584 | $56,697 | $54,909 | $52,492 | $51,084 | $49,847 | $48,273 | $46,859 | $45,981 | $45,413 | $45,255 |
| 34 |
|
South Dakota | $59,533 | $56,274 | $56,894 | $54,467 | $53,017 | $50,979 | $48,947 | $48,362 | $48,321 | $45,904 | $45,043 |
| 35 |
|
Florida | $59,227 | $55,462 | $52,594 | $50,860 | $49,426 | $47,463 | $46,036 | $45,040 | $44,299 | $44,409 | $44,736 |
| 36 |
|
Maine | $58,924 | $55,602 | $56,277 | $53,079 | $51,494 | $49,462 | $46,974 | $46,709 | $46,033 | $45,815 | $45,734 |
| 37 |
|
Ohio | $58,642 | $56,111 | $54,021 | $52,334 | $51,075 | $49,308 | $48,081 | $46,829 | $45,749 | $45,090 | $45,395 |
| 38 |
|
Indiana | $57,603 | $55,746 | $54,181 | $52,314 | $50,532 | $49,446 | $47,529 | $46,974 | $46,438 | $44,613 | $45,424 |
| 39 |
|
Missouri | $57,409 | $54,478 | $53,578 | $51,746 | $50,238 | $48,363 | $46,931 | $45,321 | $45,247 | $44,301 | $45,229 |
| 40 | North Carolina | $57,341 | $53,855 | $52,752 | $50,584 | $47,830 | $46,556 | $45,906 | $45,150 | $43,916 | $43,326 | $43,674 | |
| 41 |
|
Montana | $57,153 | $55,328 | $53,386 | $50,027 | $49,509 | $46,328 | $46,972 | $45,076 | $44,222 | $42,666 | $42,322 |
| 42 | South Carolina | $56,227 | $52,306 | $50,570 | $49,501 | $47,238 | $45,238 | $44,163 | $43,107 | $43,916 | $42,018 | $42,442 | |
| 43 |
|
Tennessee | $56,071 | $52,375 | $51,340 | $48,547 | $47,275 | $44,361 | $44,297 | $42,764 | $41,693 | $41,461 | $41,725 |
| 44 |
|
Oklahoma | $54,449 | $51,924 | $50,051 | $49,176 | $48,568 | $47,529 | $45,690 | $44,312 | $43,225 | $42,072 | $41,664 |
| 45 |
|
Kentucky | $52,295 | $50,247 | $48,375 | $46,659 | $44,765 | $42,958 | $43,399 | $41,724 | $41,141 | $40,062 | $40,072 |
| 46 |
|
New Mexico | $51,945 | $47,169 | $46,744 | $46,748 | $45,382 | $44,803 | $43,872 | $42,558 | $41,963 | $42,090 | $43,028 |
| 47 | Alabama | $51,734 | $49,861 | $48,123 | $46,257 | $44,765 | $42,830 | $42,849 | $41,574 | $41,415 | $40,474 | $40,489 | |
| 48 |
|
Louisiana | $51,073 | $47,905 | $46,145 | $45,146 | $45,727 | $44,555 | $44,164 | $42,944 | $41,734 | $42,505 | $42,429 |
| 49 |
|
Arkansas | $48,952 | $47,062 | $45,869 | $45,907 | $42,798 | $44,922 | $39,376 | $39,018 | $41,302 | $38,587 | $36,538 |
| 50 |
|
West Virginia | $48,850 | $44,097 | $43,469 | $43,385 | $42,019 | $41,059 | $41,253 | $40,196 | $38,482 | $37,218 | $37,435 |
| 51 |
|
Mississippi | $45,792 | $44,717 | $43,529 | $41,754 | $40,593 | $39,680 | $37,963 | $37,095 | $36,919 | $36,851 | $36,646 |
| 52 | Puerto Rico | $20,474 | $20,296 | $19,775 | $20,078 | $18,810 | $18,948 | $19,183 | $19,630 | — | — | — |
*change since 2009
The median personal income per person, after adjusting for costs of living with local regional price parities and the national PCE price index, averaged $47,807 in 2016 (in 2012 chained dollars). Median adjusted personal income per capita varied from $39,901 in Mississippi to $61,601 in Connecticut (and $64,363 in the District of Columbia). The states closest to the national average were California and Vermont, at $48,384 and $47,971 respectively.
Median household income by U.S. territory
Below is the median household income for the U.S. territories in 2010 (for four of the five inhabited territories). Note that Puerto Rico is not included in this table, and is instead included in the table above (because Puerto Rico is included in the ACS, as if it were a state).
| Rank | Territory | 2010 U.S. Census |
|---|---|---|
| 1 | Guam | $48,274 |
| 2 | U.S. Virgin Islands | $37,254 |
| 3 | American Samoa | $23,892 |
| 4 | Northern Mariana Islands | $19,958 |
Social class
Household income is one of the most commonly used measures of income and, therefore, also one of the most prominent indicators of social class. Household income and education do not, however, always reflect perceived class status correctly. Sociologist Dennis Gilbert acknowledges that "... the class structure... does not exactly match the distribution of household income" with "the mismatch [being] greatest in the middle..." (Gilbert, 1998: 92) As social classes commonly overlap, it is not possible to define exact class boundaries.
According to Leonard Beeghley a household income of roughly $95,000 would be typical of a dual-earner middle class household while $60,000 would be typical of a dual-earner working class household and $18,000 typical for an impoverished household. William Thompson and Joseph Hickey see common incomes for the upper class as those exceeding $500,000 with upper middle class incomes ranging from the high 5-figures to most commonly in excess of $100,000. They claim the lower middle class ranges from $35,000 to $75,000; $16,000 to $30,000 for the working class and less than $2,000 for the lower class.
| Dennis Gilbert, 2002 | William Thompson & Joseph Hickey, 2005 | Leonard Beeghley, 2004 | |||
|---|---|---|---|---|---|
| Class | Typical characteristics | Class | Typical characteristics | Class | Typical characteristics |
| Capitalist class (1%) | Top-level executives, high-rung politicians, heirs. Ivy League education common. | Upper class (1%) | Top-level executives, celebrities, heirs; income of $500,000+ common. Ivy league education common. | The super-rich (0.9%) | Multi-millionaires whose incomes commonly exceed $3.5 million or more; includes celebrities and powerful executives/politicians. Ivy League education common. |
| Upper middle class (15%) | Highly-educated (often with graduate degrees), most commonly salaried, professionals and middle management with large work autonomy. | Upper middle class (15%) | Highly-educated (often with graduate degrees) professionals & managers with household incomes varying from the high 5-figure range to commonly above $100,000. | The rich (5%) | Households with net worth of $1 million or more; largely in the form of home equity. Generally have college degrees. |
| Middle class (plurality/ majority?; ca. 46%) |
College-educated workers with considerably higher-than-average incomes and compensation; a man making $57,000 and a woman making $40,000 may be typical. | ||||
| Lower middle class (30%) | Semi-professionals and craftsmen with a roughly average standard of living. Most have some college education and are white-collar. | Lower middle class (32%) | Semi-professionals and craftsmen with some work autonomy; household incomes commonly range from $35,000 to $75,000. Typically, some college education. | ||
| Working class (30%) | Clerical and most blue-collar workers whose work is highly routinized. Standard of living varies depending on number of income earners, but is commonly just adequate. High school education. | ||||
| Working class (32%) | Clerical, pink- and blue-collar workers with often low job security; common household incomes range from $16,000 to $30,000. High school education. | Working class (ca. 40–45%) |
Blue-collar workers and those whose jobs are highly routinized with low economic security; a man making $40,000 and a woman making $26,000 may be typical. High school education. | ||
| Working poor (13%) | Service, low-rung clerical and some blue-collar workers. High economic insecurity and risk of poverty. Some high school education. | ||||
| Lower class (ca. 14–20%) | Those who occupy poorly-paid positions or rely on government transfers. Some high school education. | ||||
| Underclass (12%) | Those with limited or no participation in the labor force. Reliant on government transfers. Some high school education. | The poor (ca. 12%) | Those living below the poverty line with limited to no participation in the labor force; a household income of $18,000 may be typical. Some high school education. | ||
| |||||
Distribution of household income
Distribution of household income in 2019 according to US Census data


| Income of Household | Number (thousands) | Percent in Group | Percent At or Below | Mean Income | Mean number of earners | Mean size of household |
|---|---|---|---|---|---|---|
| Total | 128,451 | — | — | $98,088 | 1.32 | 2.53 |
| Under $5,000 | 3784 | 2.95 | 2.95 | $1,095 | 0.20 | 1.78 |
| $5,000 to $9,999 | 2702 | 2.10 | 5.05 | $7,917 | 0.36 | 1.72 |
| $10,000 to $14,999 | 5141 | 4.00 | 9.05 | $12,413 | 0.30 | 1.52 |
| $15,000 to $19,999 | 5171 | 4.03 | 13.08 | $17,358 | 0.44 | 1.68 |
| $20,000 to $24,999 | 5066 | 3.94 | 17.02 | $22,272 | 0.63 | 1.88 |
| $25,000 to $29,999 | 5247 | 4.08 | 21.10 | $27,054 | 0.74 | 2.05 |
| $30,000 to $34,999 | 5457 | 4.25 | 25.35 | $32,165 | 0.83 | 2.14 |
| $35,000 to $39,999 | 4702 | 3.65 | 29.00 | $37,127 | 0.92 | 2.23 |
| $40,000 to $44,999 | 5377 | 4.20 | 33.20 | $41,981 | 0.99 | 2.21 |
| $45,000 to $49,999 | 4972 | 3.87 | 37.07 | $47,098 | 1.05 | 2.28 |
| $50,000 to $54,999 | 4885 | 3.80 | 40.87 | $52,000 | 1.15 | 2.36 |
| $55,000 to $59,999 | 4364 | 3.40 | 44.27 | $57,148 | 1.20 | 2.44 |
| $60,000 to $64,999 | 4531 | 3.53 | 47.80 | $61,985 | 1.42 | 2.44 |
| $65,000 to $69,999 | 3655 | 2.85 | 50.65 | $67,147 | 1.42 | 2.66 |
| $70,000 to $74,999 | 3807 | 2.95 | 53.60 | $72,099 | 1.39 | 2.60 |
| $75,000 to $79,999 | 3549 | 2.75 | 56.35 | $77,015 | 1.46 | 2.61 |
| $80,000 to $84,999 | 3402 | 2.65 | 59.00 | $81,993 | 1.55 | 2.70 |
| $85,000 to $89,999 | 3013 | 2.35 | 61.35 | $87,072 | 1.62 | 2.71 |
| $90,000 to $94,999 | 3023 | 2.35 | 63.70 | $92,096 | 1.60 | 2.71 |
| $95,000 to $99,999 | 2817 | 2.20 | 65.90 | $97,282 | 1.71 | 2.86 |
| $100,000 to $104,999 | 2852 | 2.22 | 68.12 | $102,087 | 1.64 | 2.85 |
| $105,000 to $109,999 | 2491 | 1.95 | 70.07 | $107,156 | 1.73 | 2.84 |
| $110,000 to $114,999 | 2413 | 1.88 | 71.95 | $111,979 | 1.77 | 2.89 |
| $115,000 to $119,999 | 1965 | 1.53 | 73.48 | $117,101 | 1.94 | 3.11 |
| $120,000 to $124,999 | 2393 | 1.86 | 75.34 | $121,995 | 1.85 | 2.98 |
| $125,000 to $129,999 | 1785 | 1.40 | 76.74 | $127,103 | 1.89 | 3.03 |
| $130,000 to $134,999 | 1778 | 1.38 | 78.12 | $132,095 | 1.91 | 3.06 |
| $135,000 to $139,999 | 1582 | 1.23 | 79.35 | $137,223 | 1.92 | 3.06 |
| $140,000 to $144,999 | 1400 | 1.10 | 80.45 | $142,087 | 1.86 | 3.08 |
| $145,000 to $149,999 | 1311 | 1.02 | 81.47 | $147,147 | 1.92 | 3.15 |
| $150,000 to $154,999 | 1721 | 1.34 | 82.81 | $151,963 | 1.82 | 2.96 |
| $155,000 to $159,999 | 1208 | 0.94 | 83.75 | $157,272 | 2.01 | 3.11 |
| $160,000 to $164,999 | 1260 | 0.98 | 84.73 | $161,959 | 2.07 | 3.16 |
| $165,000 to $169,999 | 1008 | 0.78 | 85.51 | $167,185 | 2.12 | 3.20 |
| $170,000 to $174,999 | 1251 | 0.97 | 86.48 | $172,193 | 1.98 | 3.16 |
| $175,000 to $179,999 | 997 | 0.78 | 87.26 | $177,153 | 1.98 | 3.25 |
| $180,000 to $184,999 | 908 | 0.71 | 87.97 | $181,968 | 2.06 | 3.32 |
| $185,000 to $189,999 | 820 | 0.64 | 88.61 | $187,216 | 2.05 | 3.09 |
| $190,000 to $194,999 | 828 | 0.64 | 89.25 | $192,064 | 2.05 | 3.26 |
| $195,000 to $199,999 | 647 | 0.50 | 89.75 | $197,211 | 2.14 | 3.28 |
| $200,000 to $249,999 | 5354 | 4.15 | 93.90 | $221,050 | 2.09 | 3.23 |
| $250,000 and over | 7816 | 6.10 | 100.00 | $416,871 |
See also
- List of countries by average wage
- List of U.S. states by socioeconomic factors
- Income inequality in the United States
- Economy of the United States
- Personal income in the United States
- Employee compensation in the United States
- Standard of living in the United States
General:
- Income inequality metrics
- International Ranking of Household Income
- Marriage gap
- Median income per household member
External links
- Income, Poverty, and Health Insurance Coverage in the United States: 2003
- Reynolds, Alan (January 8, 2007). "Has U.S. Income Inequality Really Increased?" (PDF). Policy Analysis. CATO Institute.
- U.S. Census Bureau's web-site for income statistics
- NPR.org statistics and background on income inequality in the United States
- Datasets by U.S. State of low income, very low income, extremely low income limits
| |||||||||||||||||||||||||||
| |||||||||||||||||||||||||||
| |||||||||||||||||||||||||||