
Magnetic resonance elastography (MRE) is a form of elastography that specifically leverages MRI to quantify and subsequently map the mechanical properties (elasticity or stiffness) of soft tissue. First developed and described at Mayo Clinic by Muthupillai et al. in 1995, MRE has emerged as a powerful, non-invasive diagnostic tool, namely as an alternative to biopsy and serum tests for staging liver fibrosis.
Diseased tissue (e.g. a breast tumor) is often stiffer than the surrounding normal (fibroglandular) tissue, providing motivation to assess tissue stiffness. This principle of operation is the basis for the longstanding practice of palpation, which, however, is limited (except at surgery) to superficial organs and pathologies, and by its subjective, qualitative nature, depending on the skill and touch sensitivity of the practitioner. Conventional imaging techniques of CT, MRI, US, and nuclear medicine are unable to offer any insight on the elastic modulus of soft tissue. MRE, as a quantitative method of assessing tissue stiffness, provides reliable insight to visualize a variety of disease processes which affect tissue stiffness in the liver, brain, heart, pancreas, kidney, spleen, breast, uterus, prostate, and skeletal muscle.
MRE is conducted in three steps: first, a mechanical vibrator is used on the surface of the patient's body to generate shear waves that travel into the patient's deeper tissues; second, an MRI acquisition sequence measures the propagation and velocity of the waves; and finally this information is processed by an inversion algorithm to quantitatively infer and map tissue stiffness in 3-D. This stiffness map is called an elastogram, and is the final output of MRE, along with conventional 3-D MRI images as shown on the right.
Mechanics of soft tissue
MRE quantitatively determines the stiffness of biological tissues by measuring its mechanical response to an external stress. Specifically, MRE calculates the shear modulus of a tissue from its shear-wave displacement measurements. The elastic modulus quantifies the stiffness of a material, or how well it resists elastic deformation as a force is applied. For elastic materials, strain is directly proportional to stress within an elastic region. The elastic modulus is seen as the proportionality constant between stress and strain within this region. Unlike purely elastic materials, biological tissues are viscoelastic, meaning that it has characteristics of both elastic solids and viscous liquids. Their mechanical responses depend on the magnitude of the applied stress as well as the strain rate. The stress-strain curve for a viscoelastic material exhibits hysteresis. The area of the hysteresis loop represents the amount of energy lost as heat when a viscoelastic material undergoes an applied stress and is distorted. For these materials, the elastic modulus is complex and can be separated into two components: a storage modulus and a loss modulus. The storage modulus expresses the contribution from elastic solid behavior while the loss modulus expresses the contribution from viscous liquid behavior. Conversely, elastic materials exhibit a pure solid response. When a force is applied, these materials elastically store and release energy, which does not result in energy loss in the form of heat.
Yet, MRE and other elastography imaging techniques typically utilize a mechanical parameter estimation that assumes biological tissues to be linearly elastic and isotropic for simplicity purposes. The effective shear modulus can be expressed with the following equation:

![{\displaystyle \mu =E/[2(1+\nu )]}](https://wikimedia.org/api/rest_v1/media/math/render/svg/43fa67a31086c574b65db86e0df38405731f2b95)
where is the elastic modulus of the material and is the Poisson’s ratio.


The Poisson’s ratio for soft tissues is approximated to equal 0.5, resulting in the ratio between the elastic modulus and shear modulus to equal 3. This relationship can be used to estimate the stiffness of biological tissues based on the calculated shear modulus from shear-wave propagation measurements. A driver system produces and transmits acoustic waves set at a specific frequency (50–500 Hz) to the tissue sample. At these frequencies, the velocity of shear waves can be about 1–10 m/s. The effective shear modulus can be calculated from the shear wave velocity with the following:

where is the tissue density and is the shear wave velocity.


Recent studies have been focused on incorporating mechanical parameter estimations into post-processing inverse algorithms that account for the complex viscoelastic behavior of soft tissues. Creating new parameters could potentially increase the specificity of MRE measurements and diagnostic testing.
Applications
Liver

Liver fibrosis is a common condition arising in many liver diseases. Progression of fibrosis can lead to cirrhosis and end-stage liver disease. MRE-based measurement of liver stiffness has emerged as the most accurate non-invasive technique for detecting and staging liver fibrosis. MRE provides quantitative maps of tissue stiffness over large regions of the liver. Abnormally increased liver stiffness is a direct consequence of liver fibrosis. The diagnostic performance of MRE in assessing liver fibrosis has been established in multiple studies.
Liver MRE examinations are performed in MRI systems that have been equipped for the technique. Patients should fast for 3 to 4 hours prior to their MRE exam to allow for the most accurate measurement of liver stiffness. Patients lie supine in the MRI scanner for the examination. A special device is placed on the right side of the chest wall over the liver to apply gentle vibration which generates propagating shear waves in the liver. Imaging is for MRE is very quick, with data acquired in a series of 1-4 periods of breath-holding, each lasting 15–20 seconds.
A standardized approach for performing and analyzing liver MRE exams has been documented by the RSNA Quantitative Imaging Biomarkers Alliance. The technical success rate of Liver MRE is very high (95-100%)
Brain
| Magnetic resonance elastography | |
|---|---|
 Magnetic resonance elastography of the brain. A T1 weighted anatomical image is shown in the top-left, and the corresponding T2 weighted image from the MRE data is shown in the bottom-left. The wave image used to make the elastogram is shown in the top-right, and the resulting elastogram is in the bottom-right.
| |
| Purpose | measures the mechanical properties of soft tissues |
MRE of the brain was first presented in the early 2000s. Elastogram measures have been correlated with memory tasks, fitness measures, and progression of various neurodegenerative conditions. For example, regional and global decreases in brain viscoelasticity have been observed in Alzheimer’s disease and multiple sclerosis. It has been found that as the brain ages, it loses its viscoelastic integrity due to degeneration of neurons and oligodendrocytes. A recent study looked into both the isotropic and anisotropic stiffness in brain and found a correlation between the two and with age, particularly in gray matter.
MRE may also have applications for understanding the adolescent brain. Recently, it was found that adolescents have regional differences in brain viscoelasticity relative to adults.
MRE has also been applied to functional neuroimaging. Whereas functional magnetic resonance imaging (fMRI) infers brain activity by detecting relatively slow changes in blood flow, functional MRE is capable of detecting neuromechanical changes in the brain related to neuronal activity occurring on the 100-millisecond scale.
Kidney
MRE has also been applied to investigate the biomechanical properties of the kidney. The feasibility of clinical renal MRE was first reported in 2011 for healthy volunteers and in 2012 for renal transplant patients. Renal MRE is more challenging than MRE of larger organs such as the brain or liver due to fine mechanical features in the renal cortex and medulla as well as the acoustically shielded position of the kidneys within the abdominal cavity. To overcome these challenges, researchers have been looking at different passive drivers and imaging techniques to best deliver shear waves to the kidneys. Studies investigating renal diseases such as renal allograft dysfunction, lupus nephritis, immunoglobulin A nephropathy (IgAN), diabetic nephrology, renal tumors and chronic kidney disease demonstrate that kidney stiffness is sensitive to kidney function and renal perfusion.
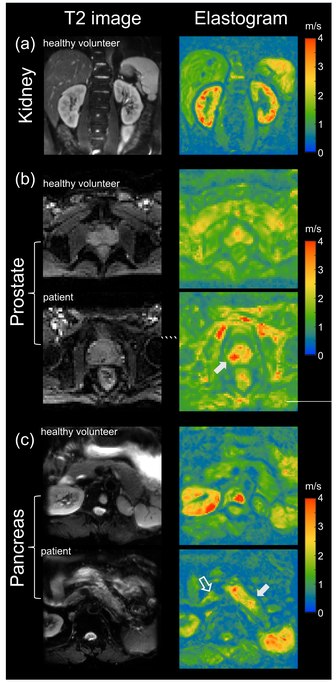
Prostate
The prostate can also be examined by MRE, in particular for the detection and diagnosis of prostate cancer. To ensure good shear wave penetration in the prostate gland, different actuator systems were designed and evaluated. Preliminary results in patients with prostate cancer showed that changes in stiffness allowed differentiation of cancerous tissue from normal tissue. Magnetic Resonance Elastography has been successfully used in patients with prostate cancer showing high specificity and sensitivity in differentiating prostate cancer from benign prostatic diseases (see figure on right (b)). Even higher specificity of 95% for prostate cancer was achieved when Magnetic Resonance Elastography was combined with systematic image interpretation using PI-RADS (version 2.1).
Pancreas
The pancreas is one of the softest tissues in the abdomen. Given that pancreatic diseases including pancreatitis and pancreatic cancer significantly increase stiffness, MRE is a promising tool for diagnosing benign and malignant conditions of the pancreas. Abnormally high pancreatic stiffness was detected by MRE in patients with both acute and chronic pancreatitis. Pancreatic stiffness was also used to distinguish pancreatic malignancy from benign masses and to predict the occurrence of pancreatic fistula after pancreaticoenteric anastomosis. Quantification of the volume of pancreatic tumors based on tomoelastographic measurement of stiffness was found to be excellently correlated with tumor volumes estimated by contrast-enhanced computed tomography. In patients with pancreatic ductal adenocarcinoma stiffness was found to be elevated in the tumor as well as in pancreatic parenchyma distal to the tumor, suggesting heterogeneous pancreatic involvement (figure on right (c)).