
Multispecies Coalescent Process is a stochastic process model that describes the genealogical relationships for a sample of DNA sequences taken from several species. It represents the application of coalescent theory to the case of multiple species. The multispecies coalescent results in cases where the relationships among species for an individual gene (the gene tree) can differ from the broader history of the species (the species tree). It has important implications for the theory and practice of phylogenetics and for understanding genome evolution.
A gene tree is a binary graph that describes the evolutionary relationships between a sample of sequences for a non-recombining locus. A species tree describes the evolutionary relationships between a set of species, assuming tree-like evolution. However, several processes can lead to discordance between gene trees and species trees. The Multispecies Coalescent model provides a framework for inferring species phylogenies while accounting for ancestral polymorphism and gene tree-species tree conflict. The process is also called the Censored Coalescent.
Besides species tree estimation, the multispecies coalescent model also provides a framework for using genomic data to address a number of biological problems, such as estimation of species divergence times, population sizes of ancestral species, species delimitation, and inference of cross-species gene flow.
Gene tree-species tree congruence

If we consider a rooted three-taxon tree, the simplest non-trivial phylogenetic tree, there are three different tree topologies but four possible gene trees. The existence of four distinct gene trees despite the smaller number of topologies reflects the fact that there are topologically identical gene tree that differ in their coalescent times. In the type 1 tree the alleles in species A and B coalesce after the speciation event that separated the A-B lineage from the C lineage. In the type 2 tree the alleles in species A and B coalesce before the speciation event that separated the A-B lineage from the C lineage (in other words, the type 2 tree is a deep coalescence tree). The type 1 and type 2 gene trees are both congruent with the species tree. The other two gene trees differ from the species tree; the two discordant gene trees are also deep coalescence trees.
The distribution of times to coalescence is actually continuous for all of these trees. In other words, the exact coalescent time for any two loci with the same gene tree may differ. However, it is convenient to break up the trees based on whether the coalescence occurred before or after the earliest speciation event.
Given the internal branch length in coalescent units it is straightforward to calculate the probability of each gene tree. For diploid organisms the branch length in coalescent units is the number of generations between the speciation events divided by twice the effective population size. Since all three of the deep coalescence tree are equiprobable and two of those deep coalescence tree are discordant it is easy to see that the probability that a rooted three-taxon gene tree will be congruent with the species tree is:

Where the branch length in coalescent units (T) is also written in an alternative form: the number of generations (t) divided by twice the effective population size (Ne). Pamilo and Nei also derived the probability of congruence for rooted trees of four and five taxa as well as a general upper bound on the probability of congruence for larger trees. Rosenberg followed up with equations used for the complete set of topologies (although the large number of distinct phylogenetic trees that becomes possible as the number of taxa increases makes these equations impractical unless the number of taxa is very limited).
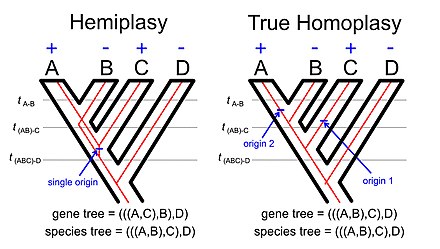
The phenomenon of hemiplasy is a natural extension of the basic idea underlying gene tree-species tree discordance. If we consider the distribution of some character that disagrees with the species tree it might reflect homoplasy (multiple independent origins of the character or a single origin followed by multiple losses) or it could reflect hemiplasy (a single origin of the trait that is associated with a gene tree that disagrees with the species tree).
The phenomenon called incomplete lineage sorting (often abbreviated ILS in the scientific literatures) is linked to the phenomenon. If we examine the illustration of hemiplasy with using a rooted four-taxon tree (see image to the right) the lineage between the common ancestor of taxa A, B, and C and the common ancestor of taxa A and B must be polymorphic for the allele with the derived trait (e.g., a transposable element insertion) and the allele with the ancestral trait. The concept of incomplete lineage sorting ultimately reflects on persistence of polymorphisms across one or more speciation events.
Mathematical description of the multispecies coalescent
The probability density of the gene trees under the multispecies coalescent model is discussed along with its use for parameter estimation using multi-locus sequence data.
Assumptions
In the basic multispecies coalescent model, the species phylogeny is assumed to be known. Complete isolation after species divergence, with no migration, hybridization, or introgression is also assumed. We assume no recombination so that all the sites within the locus share the same gene tree (topology and coalescent times). However, the basic model can be extended in different ways to accommodate migration or introgression, population size changes, recombination.
Data and model parameters
The model and implementation of this method can be applied to any species tree. As an example, the species tree of the great apes: humans (H), chimpanzees (C), gorillas (G) and orangutans (O) is considered. The topology of the species tree, (((HC)G)O)), is assumed known and fixed in the analysis (Figure 1). Let be the entire data set, where represent the sequence alignment at locus , with for a total of loci.


The population size of a current species is considered only if more than one individual is sampled from that species at some loci.
The parameters in the model for the example of Figure 1 include the three divergence times , and and population size parameters for humans; for chimpanzees; and , and for the three ancestral species.


The divergence times ('s) are measured by the expected number of mutations per site from the ancestral node in the species tree to the present time (Figure 1 of Rannala and Yang, 2003).

Therefore, the parameters are .

Distribution of gene genealogies
The joint distribution of is derived directly in this section. Two sequences from different species can coalesce only in one populations that are ancestral to the two species. For example, sequences H and G can coalesce in populations HCG or HCGO, but not in populations H or HC. The coalescent processes in different populations are different.

For each population, the genealogy is traced backward in time, until the end of the population at time , and the number of lineages entering the population and the number of lineages leaving it are recorded. For example, and , for population H (Table 1). This process is called a censored coalescent process because the coalescent process for one population may be terminated before all lineages that entered the population have coalesced. If the population consists of disconnected subtrees or lineages.


With one time unit defined as the time taken to accumulate one mutation per site, any two lineages coalesce at the rate . The waiting time until the next coalescent event, which reduces the number of lineages from to has exponential density


If , the probability that no coalescent event occurs between the last one and the end of the population at time ; i.e. during the time interval . This probability is and is 1 if .

![{\displaystyle \exp\{-{\frac {n(n-1)}{\theta }}[\tau -(t_{m}+t_{m-1}+\ldots +t_{n+1})]}](https://wikimedia.org/api/rest_v1/media/math/render/svg/2f435c3e48b6ad522af7d79165c8713ab6a42446)

(Note: One should recall that the probability of no events over time interval for a Poisson process with rate is . Here the coalescent rate when there are lineages is .)


In addition, to derive the probability of a particular gene tree topology in the population, if a coalescent event occurs in a sample of lineages, the probability that a particular pair of lineages coalesce is .

Multiplying these probabilities together, the joint probability distribution of the gene tree topology in the population and its coalescent times as

- .
![{\displaystyle \prod _{j=n+1}^{m}{\Big [}{\frac {2}{\theta }}\exp {\Big \{}-{\frac {j(j-1)}{\theta }}t_{j}{\Big \}}{\Big ]}\exp {\Big \{}-{\frac {n(n-1)}{\theta }}(\tau -(t_{m}+t_{m+1}+\ldots +t_{n+1})){\Big \}}}](https://wikimedia.org/api/rest_v1/media/math/render/svg/a7937f1541db74c1d61321eb52a49d5a32f19407)
The probability of the gene tree and coalescent times for the locus is the product of such probabilities across all the populations. Therefore, the gene genealogy of Figure 1, we have
![{\displaystyle {\begin{aligned}f(G_{i}\mid \Theta )&=[2/\theta _{H}\exp\{-6t_{3}^{(H)}/\theta _{H}\}\exp\{-2(\tau _{HC}-t_{3}^{(H)})/\theta _{H}\}]\\&{}\times [2/\theta _{C}\exp\{-2t_{2}^{(C)}/\theta _{C}\}]\\&{}\times [2/\theta _{HC}\exp\{-6t_{3}^{HC}/\theta _{HC}\}]\times [2/\theta _{HC}\exp\{-2t_{2}^{HC}/\theta _{HC}\}]\\&{}\times [\exp\{-2(\tau _{HCG}-\tau _{HG}-(t_{3}^{HC}+t_{2}^{HC}))/\theta _{HCG}\}]\\&{}\times [2/\theta _{HCGO}\exp\{-6t_{3}^{HCGO}/\theta _{HCGO}\}]\times [2/\theta _{HCGO}\exp\{-2t_{2}^{HCGO}/\theta _{HCGO}\}]\end{aligned}}}](https://wikimedia.org/api/rest_v1/media/math/render/svg/2d396905de66e7b66c05298abe56ddc5be144a53)
Likelihood-based inference
The gene genealogy at each locus is represented by the tree topology and the coalescent times . Given the species tree and the parameters on it, the probability distribution of is specified by the coalescent process as


- ,

where is the probability density for the gene tree at locus locus , and the product is because we assume that the gene trees are independent given the parameters.

The probability of data given the gene tree and coalescent times (and thus branch lengths) at the locus, , is Felsenstein's phylogenetic likelihood. Due to the assumption of independent evolution across the loci,


The likelihood function or the probability of the sequence data given the parameters is then an average over the unobserved gene trees

where the integration represents summation over all possible gene tree topologies () and, for each possible topology at each locus, integration over the coalescent times . This is in general intractable except for very small species trees.
In Bayesian inference, we assign a prior on the parameters, , and then the posterior is given as


where again the integration represents summation over all possible gene tree topologies () and integration over the coalescent times . In practice this integration over the gene trees is achieved through a Markov chain Monte Carlo algorithm, which samples from the joint conditional distribution of the parameters and the gene trees

The above assumes that the species tree is fixed. In species-tree estimation, the species tree () changes as well, so that the joint conditional distribution (from which the MCMC samples) is


where is the prior on species trees.

As a major departure from two-step summary methods, full-likelihood methods average over the gene trees. This means that they make use of information in the branch lengths (coalescent times) on the gene trees and accommodate their uncertainties (due to limited sequence length in the alignments) at the same time. It also explains why full-likelihood methods are computationally much more demanding than two-step summary methods.
Markov chain Monte Carlo under the multispecies coalescent
The integration or summation over the gene trees in the definition of the likelihood function above is virtually impossible to compute except for very small species trees with only two or three species. Full-likelihood or full-data methods, based on calculation of the likelihood function on sequence alignments, have thus mostly relied on Markov chain Monte Carlo algorithms. MCMC algorithms under the multispecies coalescent model are similar to those used in Bayesian phylogenetics but are distinctly more complex, mainly due to the fact that the gene trees at multiple loci and the species tree have to be compatible: sequence divergence has to be older than species divergence. As a result, changing the species tree while the gene trees are fixed (or changing a gene tree while the species tree is fixed) leads to inefficient algorithms with poor mixing properties. Considerable efforts have been taken to design smart algorithms that change the species tree and gene trees in a coordinated manner, as in the rubber-band algorithm for changing species divergence times, the coordinated NNI, SPR and NodeSlider moves.
Consider for example the case of two species (A and B) and two sequences at each locus, with a sequence divergence time at locus . We have for all . When we want to change the species divergence time within the constraint of the current , we may have very little room for change, as may be virtually identical to the smallest of the . The rubber-band algorithm changes without consideration of the , and then modifies the deterministically in the same way that marks on a rubber band move when the rubber band is held from a fixed point pulled towards one end. In general, the rubber-band move guarantees that the ages of nodes in the gene trees are modified so that they remain compatible with the modified species divergence time.

Full likelihood methods tend to reach their limit when the data consist of a few hundred loci, even though more than 10,000 loci have been analyzed in a few published studies.
Extensions
The basic multispecies coalescent model can be extended in a number of ways to accommodate major factors of the biological process of reproduction and drift. For example, incorporating continuous-time migration leads to the MSC+M (for MSC with migration) model, also known as the isolation-with-migration or IM models. Incorporating episodic hybridization/introgression leads to the MSC with introgression (MSci) or multispecies-network-coalescent (MSNC) model.
Impact on phylogenetic estimation
The multispecies coalescent has profound implications for the theory and practice of molecular phylogenetics. Since individual gene trees can differ from the species tree one cannot estimate the tree for a single locus and assume that the gene tree correspond the species tree. In fact, one can be virtually certain that any individual gene tree will differ from the species tree for at least some relationships when any reasonable number of taxa are considered. However, gene tree-species tree discordance has an impact on the theory and practice of species tree estimation that goes beyond the simple observation that one cannot use a single gene tree to estimate the species tree because there is a part of parameter space where the most frequent gene tree is incongruent with the species tree. This part of parameter space is called the anomaly zone and any discordant gene trees that are more expected to arise more often than the gene tree. that matches the species tree are called anomalous gene trees.
The existence of the anomaly zone implies that one cannot simply estimate a large number of gene trees and assume the gene tree recovered the largest number of times is the species tree. Of course, estimating the species tree by a "democratic vote" of gene trees would only work for a limited number of taxa outside of the anomaly zone given the extremely large number of phylogenetic trees that are possible. However, the existence of the anomalous gene trees also means that simple methods for combining gene trees, like the majority rule extended ("greedy") consensus method or the matrix representation with parsimony (MRP) supertree approach, will not be consistent estimators of the species tree (i.e., they will be misleading). Simply generating the majority-rule consensus tree for the gene trees, where groups that are present in at least 50% of gene trees are retained, will not be misleading as long as a sufficient number of gene trees are used. However, this ability of the majority-rule consensus tree for a set of gene trees to avoid incorrect clades comes at the cost of having unresolved groups.
Simulations have shown that there are parts of species tree parameter space where maximum likelihood estimates of phylogeny are incorrect trees with increasing probability as the amount of data analyzed increases. This is important because the "concatenation approach," where multiple sequence alignments from different loci are concatenated to form a single large supermatrix alignment that is then used for maximum likelihood (or Bayesian MCMC) analysis, is both easy to implement and commonly used in empirical studies. This represents a case of model misspecification because the concatenation approach implicitly assumes that all gene trees have the same topology. Indeed, it has now been proven that analyses of data generated under the multispecies coalescent using maximum likelihood analysis of a concatenated data are not guaranteed to converge on the true species tree as the number of loci used for the analysis increases (i.e., maximum likelihood concatenation is statistically inconsistent).
Software for inference under the multispecies coalescent
There are two basic approaches for phylogenetic estimation in the multispecies coalescent framework: 1) full-likelihood or full-data methods which operate on multilocus sequence alignments directly, including both maximum likelihood and Bayesian methods, and 2) summary methods, which use a summary of the original sequence data, including the two-step methods that use estimated gene trees as summary input and SVDQuartets, which use site pattern counts pooled over loci as summary input.
| Program | Description | Method | References |
|---|---|---|---|
| ASTRAL | ASTRAL (Accurate Species TRee ALgorithm) summarizes a set of gene trees using a quartet method generate an estimate of the species tree with coalescent branch lengths and support values (local posterior probabilities) | Summary | Mirarab et al. (2014); Zhang et al. (2018) |
| ASTRID | ASTRID (Accurate Species TRees from Internode Distances) is an extension of the NJst method. ASTRID/NJst is a summary species tree method that calculates the internode distances from a set of input gene trees. A distance method like neighbor joining or minimum evolution is then used to estimate the species tree from those distances. Note that ASTRID/NJst is not consistent under a model of missing data | Summary | Vachaspati and Warnow (2015) |
| BPP | Bayesian MCMC software package for inferring phylogeny and divergence times among populations under the multispecies coalescent process; also includes method for species delimitation | Full likelihood | Yang et al. (2015); Flouri et al. (2018) |
| STACEY | Bayesian MCMC software package for inferring phylogeny and divergence times among populations under the multispecies coalescent process; minimal clusters (samples assumed to belong to the same species according to the model) are sampled during the MCMC without the need to change parameters space | Full likelihood | Jones et al. (2015); Jones GR (2018) |
| *BEAST | Bayesian MCMC software package for inferring phylogeny and divergence times among populations under the multispecies coalescent process. Implemented as part of the BEAST software package (pronounced Star BEAST) | Full likelihood | Heled and Drummond (2010) |
| MP-EST | Accepts a set of gene trees as input and generates the maximum pseudolikelihood estimate of the species tree | Summary | Liu et al. (2010) |
| SVDquartets (implemented in PAUP*) | PAUP* is a general phylogenetic estimation package that implements many methods. SVDquartets is a method that has shown to be statistically consistent for data generated given the multispecies coalescent | Summary/Site-pattern method | Chifman and Kubatko (2014) |