
Positron emission tomography for bone imaging, as an in vivo tracer technique, allows the measurement of the regional concentration of radioactivity proportional to the image pixel values averaged over a region of interest (ROI) in bones. Positron emission tomography is a functional imaging technique that uses [18F]NaF radiotracer to visualise and quantify regional bone metabolism and blood flow. [18F]NaF has been used for imaging bones for the last 60 years. This article focuses on the pharmacokinetics of [18F]NaF in bones, and various semi-quantitative and quantitative methods for quantifying regional bone metabolism using [18F]NaF PET images.
Use of [18F]NaF PET
The measurement of regional bone metabolism is critical to understand the pathophysiology of metabolic bone diseases.
- Bone biopsy is considered the gold standard to quantify bone turnover; however, it is invasive, complex and costly to perform and subject to significant measurement errors.
- Measurements of serum or urine biomarkers of bone turnover are simple, cheap, quick, and non-invasive in measuring changes in bone metabolism, but only provide information on the global skeleton.
- The functional imaging technique of dynamic [18F]NaF PET scans can quantify regional bone turnover at specific sites of clinical importance such as the lumbar spine and hip and has been validated by comparison with the gold standard of bone biopsy.
Pharmacokinetics of [18F]NaF
The chemically stable anion of Fluorine-18-Fluoride is a bone-seeking radiotracer in skeletal imaging. [18F]NaF has an affinity to deposit at areas where the bone is newly mineralizing. Many studies have [18F]NaF PET to measure bone metabolism at the hip,lumbar spine, and humerus. [18F]NaF is taken-up in an exponential manner representing the equilibration of tracer with the extracellular and cellular fluid spaces with a half-life of 0.4 hours, and with kidneys with a half-life of 2.4 hours. The single passage extraction of [18F]NaF in bone is 100%. After an hour, only 10% of the injected activity remains in the blood.
18F- ions are considered to occupy extracellular fluid spaces because, firstly, they equilibrate with transcellular fluid spaces and secondly, they are not entirely extracellular ions. Fluoride undergoes equilibrium with hydrogen fluoride, which has a high permeability allowing fluoride to cross the plasma blood membrane. The fluoride circulation in red blood cells accounts for 30%. However, it is freely available to the bone surface for uptake because the equilibrium between erythrocytes and plasma is much faster than the capillary transit time. This is supported by studies reporting 100% single-passage extraction of whole-blood 18F- ion by bone and the rapid release of 18F- ions from erythrocytes with a rate constant of 0.3 per second.
[18F]NaF is also taken-up by immature erythrocytes in the bone marrow, which plays a role in fluoride kinetics. The plasma protein binding of [18F]NaF is negligible. [18F]NaF renal clearance is affected by diet and pH level, due to its re-absorption in the nephron, which is mediated by hydrogen fluoride. However, large differences in urine flow rate are avoided for controlled experiments by keeping patents well hydrated.
The exchangeable pool and the size of the metabolically active surfaces in bones determines the amount of tracer accumulated or exchanged with bone extracellular fluid,chemisorption onto hydroxyapatite crystals to form fluorapatite, as shown in Equation-1:
Equation-1

Fluoride ions from the crystalline matrix of bone are released when the bone is remodelled, thus providing a measure of the rate of bone metabolism.
Measuring SUV
Definition
The standardized uptake value (SUV) is defined as tissue concentration (KBq/ml) divided by activity injected normalized for body weight.
Appropriateness
The SUV measured from the large ROI smooths out the noise and, therefore, more appropriate in [18F]NaF bone studies as the radiotracer is fairly uniformly taken up throughout the bone. The measurement of SUV is easy, cheap, and quicker to perform, making it more attractive for clinical use. It has been used in diagnosing and assessing the efficacy of therapy. SUV can be measured at a single site, or the whole skeleton using a series of static scans and restricted by the small field-of-view of the PET scanner.
Known Issues
The SUV has emerged as a clinically useful, albeit controversial, semi-quantitative tool in PET analysis. Standardizing imaging protocols and measuring the SUV at the same time post-injection of the radiotracer, is necessary to obtain a correct SUV because imaging before the uptake plateau introduces unpredictable errors of up to 50% with SUVs. Noise, image resolution, and reconstruction do affect the accuracy of SUVs, but correction with phantom can minimize these differences when comparing SUVs for multi-centre clinical trials. SUV may lack sensitivity in measuring response to treatment as it is a simple measure of tracer uptake in bone, which is affected by the tracer uptake in other competing tissues and organs in addition to the target ROI.
Measuring Ki
The quantification of dynamic PET studies to measure Ki requires the measurement of the skeletal time-activity curves (TAC) from the region of interest (ROI) and the arterial input function (AIF), which can be measured in various different ways. However, the most common is to correct the image-based blood time-activity curves using several venous blood samples taken at discrete time points while the patient is scanned. The calculation of rate constants or Ki requires three steps:
- Measurement of the arterial input function (AIF), which acts as the first input to the mathematical model of tracer distribution.
- Measurement of the time-activity curve (TAC) within the skeletal region of interest, which acts as the second input to the mathematical model of tracer distribution.
- Kinetic modelling of AIF and TAC using mathematical modelling to obtain net plasma clearance (Ki) to the bone mineral.

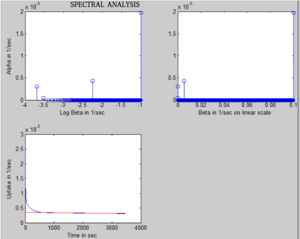
Spectral method
The method was first described by Cunningham & Jones in 1993 for the analysis of dynamic PET data obtained in the brain. It assumes that the tissue impulse response function (IRF) can be described as a combination of many exponentials. Since A tissue TAC can be expressed as a convolution of measured arterial input function with IRF, Cbone(t) can be expressed as:

where, is a convolution operator, Cbone(t) is the bone tissue activity concentration of tracer (in units: MBq/ml) over a period of time t, Cplasma(t) is the plasma concentration of tracer (in units: MBq/ml) over a period of time t, IRF(t) is equal to the sum of exponentials, β values are fixed between 0.0001 sec−1 and 0.1 sec−1 in intervals of 0.0001, n is the number of α components that resulted from the analysis and β1, β2,..., βn corresponds to the respective α1, α2,..., αn components from the resulted spectrum. The values of α are then estimated from the analysis by fitting multi-exponential to the IRF. The intercept of the linear fit to the slow component of this exponential curve is considered the plasma clearance (Ki) to the bone mineral.

Deconvolution method
The method was first described by Williams et al. in the clinical context. The method was used by numerous other studies. This is perhaps the simplest of all the mathematical methods for the calculation of Ki but the one most sensitive to noise present in the data. A tissue TAC is modelled as a convolution of measured arterial input function with IRF, the estimates for IRF are obtained iteratively to minimise the differences between the left- and right-hand side of the following Equation:

where, is a convolution operator, Cbone(t) is the bone tissue activity concentration of tracer (in units: MBq/ml) over a period of time t, Cplasma(t) is the plasma concentration of tracer (in units: MBq/ml) over a period of time t, and IRF(t) is the impulse response of the system (i.e., a tissue in this case). The Ki is obtained from the IRF in a similar fashion to that obtained for the spectral analysis, as shown in the figure.
Hawkins model

The measurement of Ki from dynamic PET scans require tracer kinetic modelling to obtain the model parameters describing the biological processes in bone, as described by Hawkins et al. Since this model has two tissue compartments, it is sometimes called a two-tissue compartmental model. Various different versions of this model exist; however, the most fundamental approach is considered here with two tissue compartments and four tracer-exchange parameters. The whole kinetic modelling process using Hawkins model can be summed up in a single image as seen on the right-hand-side. The following differential equations are solved to obtain the rate constants:


The rate constant K1 (in units: ml/min/ml) describes the unidirectional clearance of fluoride from plasma to the whole of the bone tissue, k2 (in units: min−1) describes the reverse transport of fluoride from the ECF compartment to plasma, k3 and k4 (in units min−1) describe the forward and backward transportation of fluoride from the bone mineral compartment.
Ki represents the net plasma clearance to bone mineral only. Ki is a function of both K1, reflecting bone blood flow, and the fraction of the tracer that undergoes specific binding to the bone mineral k3 / (k2 + k3). Therefore,

Hawkins et al. found that the inclusion of an additional parameter called fractional blood volume (BV), representing the vascular tissue spaces within the ROI, improved the data fitting problem, although this improvement was not statistically significant.
Patlak method
Patlak method is based on the assumption that the backflow of tracer from bone mineral to bone ECF is zero (i.e., k4=0). The calculation of Ki using Patlak method is simpler than using non-linear regression (NLR) fitting the arterial input function and the tissue time-activity curve data to the Hawkins model. It is crucial to note that Patlak method can only measure bone plasma clearance (Ki), and cannot measure the individual kinetic parameters, K1, k2, k3, or k4.
The concentration of tracer in tissue region-of-interest can be represented as a sum of concentration in bone ECF and the bone mineral. It can be mathematically represented as

where, within the tissue region-of-interest from the PET image, Cbone(T) is the bone tissue activity concentration of tracer (in units: MBq/ml) at any time T, Cplasma(T) is the plasma concentration of tracer (in units: MBq/ml) at time T, Vo is the fraction of the ROI occupied by the ECF compartment, and is the area under the plasma curve is the net tracer delivery to the tissue region of interest (in units: MBq.Sec/ml) over time T. The Patlak equation is a linear equation of the form


Therefore, linear regression is fitted to the data plotted on Y- and X-axis between 4–60 minutes to obtain m and c values, where m is the slope of the regression line representing Ki and c is the Y-intercept of the regression line representing Vo.
Siddique–Blake method
The calculation of Ki using arterial input function, time-activity curve, and Hawkins model was limited to a small skeletal region covered by the narrow field-of-view of the PET scanner while acquiring a dynamic scan. However, Siddique et al. showed in 2012 that it is possible to measure Ki values in bones using static [18F]NaF PET scans. Blake et al. later showed in 2019 that the Ki obtained using the Siddique–Blake method has precision errors of less than 10%. The Siddique–Blake approach is based on the combination of the Patlak method, the semi-population based arterial input function, and the information that Vo does not significantly change post-treatment. This method uses the information that a linear regression line can be plotted using the data from a minimum of two time-points, to obtain m and c as explained in the Patlak method. However, if Vo is known or fixed, only one single static PET image is required to obtain the second time-point to measure m, representing the Ki value. This method should be applied with great caution to other clinical areas where these assumptions may not hold true.
SUV vs Ki
The most fundamental difference between SUV and Ki values is that SUV is a simple measure of uptake, which is normalized to body weight and injected activity. The SUV does not take into consideration the tracer delivery to the local region of interest from where the measurements are obtained, therefore, affected by the physiological process consuming [18F]NaF elsewhere in the body. On the other hand, Ki measures the plasma clearance to bone mineral, taking into account the tracer uptake elsewhere in the body affecting the delivery of tracer to the region of interest from where the measurements are obtained. The difference in the measurement of Ki and SUV in bone tissue using [18F]NaF are explained in more detail by Blake et al.
It is critical to note that most of the methods for calculating Ki require dynamic PET scanning over an hour, except, the Siddique–Blake methods. Dynamic scanning is complicated and costly. However, the calculation of SUV requires a single static PET scan performed approximately 45–60 minutes post-tracer injection at any region imaged within the skeleton.
Many researchers have shown a high correlation between SUV and Ki values at various skeletal sites. However, SUV and Ki methods can contradict for measuring response to treatment. Since SUV has not been validated against the histomorphometry, its usefulness in bone studies measuring response to treatment and disease progression is uncertain.
See also
- Bone
- Positron emission tomography
- Time-activity curve
- Arterial input function
- Medical Imaging
- Radiology
- Molecular Imaging
- Medical Imaging
- Bone scintigraphy
|
Library resources about PET |
| |||||||||||||||||||||||||||||||||||||||||||||||||||||||
| |||||||||||||||||||||||||||||||||||||||||||||||||||||||
|
X-ray/ radiography |
|||||||||||||
|---|---|---|---|---|---|---|---|---|---|---|---|---|---|
| MRI | |||||||||||||
| Ultrasound | |||||||||||||
| Radionuclide |
|
||||||||||||
| Optical/Laser | |||||||||||||
| Thermography | |||||||||||||
| Target conditions | |||||||||||||