
| Timeline, tables and graphs | |
|---|---|
 WHO flag
| |
| Notation | Timeline, tables and graphs at the apex of the West African Ebola virus epidemic |
| Table of graphs and parameters | |
In March 2014, the World Health Organization (WHO) reported a major Ebola outbreak in Guinea, a western African nation, the disease then rapidly spread to the neighboring countries of Liberia and Sierra Leone with smaller outbreaks occurring in Senegal, Nigeria, and Mali; the resulting West African Ebola virus epidemic is the largest Ebola outbreak (cases and deaths) ever documented.
Background
| Articles related to the |
| Western African Ebola virus epidemic |
|---|
 |
| Overview |
| Nations with widespread cases |
| Other affected nations |
| Other outbreaks |
Researchers believe that a 2-year-old boy who lived in the village of Meliandou, Guéckédou Prefecture, Guinea was the index case of the current Ebola virus disease epidemic. The boy died in December 2013. His mother, sister, and grandmother then became ill with similar symptoms and also died. Although Ebola represents a significant public health problem in sub-Saharan Africa and was documented in Tai Forest chimpanzees, only one case had been reported in humans in West Africa. With this background and in the context of poor public health systems, the early cases were mis-diagnosed as diseases more common to the area. Thus Ebola virus disease spread for several months before it was recognized as such. In late October 2014, the boy was later identified as Emile Ouamouno. In a Tuesday, December 30, 2014 online world news story article by Richard Ingham from the Agence France-Presse (AFP) that was featured on the MSN homepage, it was revealed that a tree in the area where children had played at, playing with insect-eating free-tailed bats and hunting and grilling them to eat (they are a cousin of another well-known Ebola reservoir, the fruit bat, whose role in this outbreak is not as clear), is believed to be the point where human infection – likely by the bats – with Ebola in this current outbreak occurred, the 'ground zero' of the epidemic. This is not yet known decisively, but scientists have enough knowledge to go public with the story.
Timeline of reported cases and deaths
Data sources
Data comes from reports by the World Health Organization Global Alert and Response Unit and the WHO's Regional Office for Africa. All numbers are correlated with United Nations Office for the Coordination of Humanitarian Affairs (OCHA), if available. The reports are sourced from official information from the affected countries' health ministries. The WHO has stated the reported numbers "vastly underestimate the magnitude of the outbreak", estimating there may be 3 times as many cases as officially reported.
Understanding the data and its limitations
Each row of the table represents the best available information cross-checked from multiple sources on the day it was reported. The data may be inaccurate for the following reasons:
- Each data source or report may or may not include suspected cases that have not yet been confirmed.
- Each source or report may or may not include probable cases.
- Case numbers may be revised downward if a probable or suspected case is later found to be negative. (Numbers may differ from reports as per respective Government reports. See notes at the bottom for stated source file.)
- The reports usually refer to cumulative data totals since the start of the 2014 epidemic. When new data becomes available or old data is revised the correction could apply either to the past or the present.
- The number of deaths may be revised downwards if it is later found from testing those deaths were not from Ebola.
- There are variable delays in gathering, correcting and reporting the data from multiple sources.
- It is not possible to infer the rate of growth or decline in the spread of the disease from the cumulative data or the graphs; they simply reflect a timeline of the available data as reported on any given date. The real-world spread could be slowing while reported cumulative cases rise at a faster rate due to improved reporting, or the real-world spread could be increasing with flat cumulative data due to lack of reporting.
Graphs
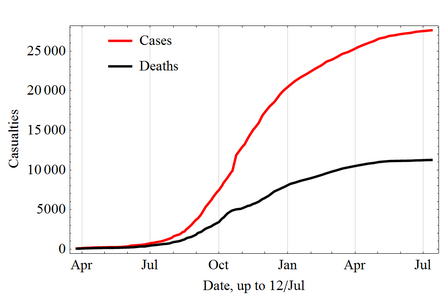
Cumulative totals of cases and deaths over time
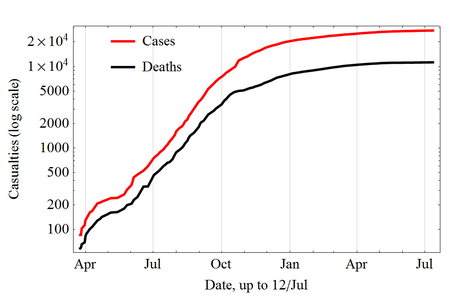
Cumulative totals in log scale
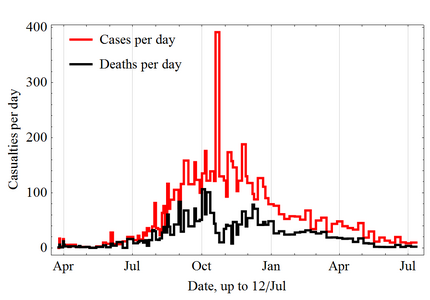
Cases per day in linear scale
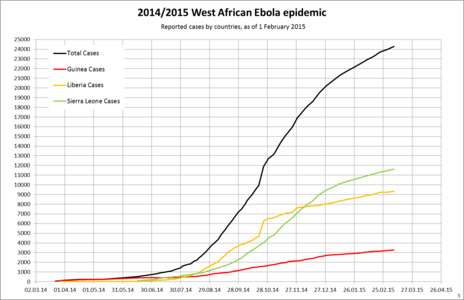
Cumulative number of cases by country, using a linear scale
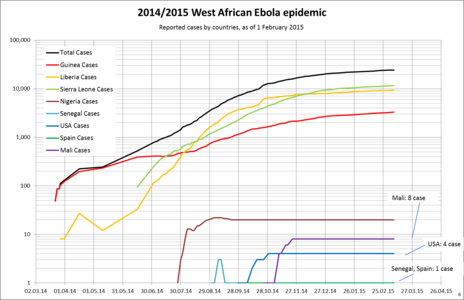
Cumulative number of cases by country, using a logarithmic scale
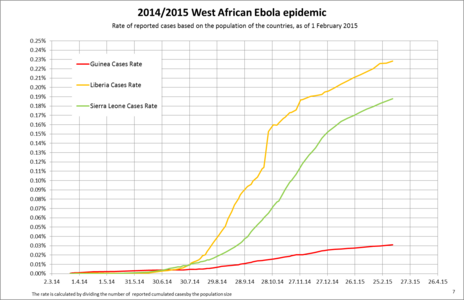
Cases based on population, using a linear scale
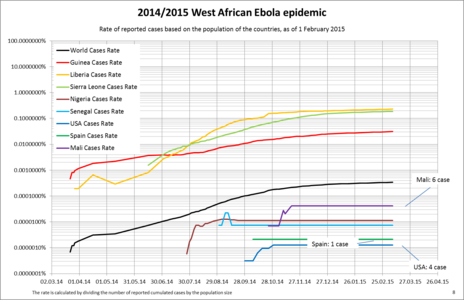
Cases based on population, using a logarithmic scale

Weekly cases, total and per country


Tables
- For the final numbers, which would include flare-ups please see infobox at West African Ebola virus epidemic
| Date | Total |
|
|
|
Sources | ||||
|---|---|---|---|---|---|---|---|---|---|
| Cases | Deaths | Cases | Deaths | Cases | Deaths | Cases | Deaths | ||
| 25 Nov 2015 | 28,637 | 11,314 | 3,804 | 2,536 | 10,675 | 4,808 | 14,122 | 3,955 | |
| 18 Nov 2015 | 28,634 | 11,314 | 3,804 | 2,536 | 10,672 | 4,808 | 14,122 | 3,955 | |
| 11 Nov 2015 | 28,635 | 11,314 | 3,805 | 2,536 | 10,672 | 4,808 | 14,122 | 3,955 | |
| 4 Nov 2015 | 28,607 | 11,314 | 3,810 | 2,536 | 10,672 | 4,808 | 14,089 | 3,955 | |
| 25 Oct 2015 | 28,539 | 11,298 | 3,806 | 2,535 | 10,672 | 4,808 | 14,061 | 3,955 | |
| 18 Oct 2015 | 28,476 | 11,298 | 3,803 | 2,535 | 10,672 | 4,808 | 14,001 | 3,955 | |
| 11 Oct 2015 | 28,454 | 11,297 | 3,800 | 2,534 | 10,672 | 4,808 | 13,982 | 3,955 | |
| 27 Sep 2015 | 28,388 | 11,296 | 3,805 | 2,533 | 10,672 | 4,808 | 13,911 | 3,955 | |
| 20 Sep 2015 | 28,295 | 11,295 | 3,800 | 2,532 | 10,672 | 4,808 | 13,823 | 3,955 | |
| 13 Sep 2015 | 28,220 | 11,291 | 3,792 | 2,530 | 10,672 | 4,808 | 13,756 | 3,953 | |
| 6 Sep 2015 | 28,147 | 11,291 | 3,792 | 2,530 | 10,672 | 4,808 | 13,683 | 3,953 | |
| 30 Aug 2015 | 28,073 | 11,290 | 3,792 | 2,529 | 10,672 | 4,808 | 13,609 | 3,953 | |
| 16 Aug 2015 | 27,952 | 11,284 | 3,786 | 2,524 | 10,672 | 4,808 | 13,494 | 3,952 | |
| 9 Aug 2015 | 27,929 | 11,283 | 3,787 | 2,524 | 10,672 | 4,808 | 13,470 | 3,951 | |
| 26 Jul 2015 | 27,748 | 11,279 | 3,786 | 2,520 | 10,672 | 4,808 | 13,290 | 3,951 | |
| 12 Jul 2015 | 27,642 | 11,261 | 3,760 | 2,506 | 10,673 | 4,808 | 13,209 | 3,947 | |
| 5 Jul 2015 | 27,573 | 11,246 | 3,748 | 2,499 | 10,670 | 4,807 | 13,155 | 3,940 | |
| 28 Jun 2015 | 27,514 | 11,220 | 3,729 | 2,482 | 10,666 | 4,806 | 13,119 | 3,932 | |
| 21 Jun 2015 | 27,443 | 11,207 | 3,718 | 2,473 | 10,666 | 4,806 | 13,059 | 3,924 | |
| 14 Jun 2015 | 27,305 | 11,169 | 3,674 | 2,444 | 10,666 | 4,806 | 12,965 | 3,919 | |
| 31 May 2015 | 27,110 | 11,132 | 3,652 | 2,429 | 10,666 | 4,806 | 12,827 | 3,912 | |
| 17 May 2015 | 26,898 | 11,105 | 3,635 | 2,407 | 10,666 | 4,806 | 12,632 | 3,907 | |
| 3 May 2015 | 26,558 | 10,990 | 3,589 | 2,386 | 10,564 | 4,716 | 12,440 | 3,903 | |
| 19 Apr 2015 | 26,009 | 10,793 | 3,565 | 2,358 | 10,212 | 4,573 | 12,267 | 3,877 | |
| 5 Apr 2015 | 25,480 | 10,557 | 3,515 | 2,333 | 9,862 | 4,408 | 12,138 | 3,831 | |
| 22 Mar 2015 | 24,837 | 10,296 | 3,429 | 2,263 | 9,602 | 4,301 | 11,841 | 3,747 | |
| 8 Mar 2015 | 24,282 | 9,976 | 3,285 | 2,170 | ≥9,343 | ≥4,162 | 11,619 | 3,629 | |
| 22 Feb 2015 | 23,659 | 9,574 | 3,155 | 2,091 | 9,238 | 4,037 | 11,301 | 3,461 | |
| 8 Feb 2015 | 22,824 | 9,147 | 3,044 | 1,995 | ≥8,881 | ≥3,826 | 10,934 | 3,341 | |
| 25 Jan 2015 | 22,022 | 8,780 | 2,917 | 1,910 | 8,622 | 3,686 | 10,518 | 3,199 | |
| 11 Jan 2015 | 21,226 | 8,399 | 2,806 | 1,814 | 8,331 | 3,538 | 10,124 | 3,062 | |
| 28 Dec 2014 | 20,171 | 7,890 | 2,707 | 1,709 | 8,018 | 3,423 | 9,446 | 2,758 | |
| 14 Dec 2014 | 18,565 | 7,273 | 2,415 | 1,525 | 7,819 | 3,346 | 8,356 | 2,417 | |
| 30 Nov 2014 | 17,110 | 6,397 | 2,164 | 1,325 | 7,653 | 3,157 | 7,312 | 1,915 | |
| 18 Nov 2014 | 15,291 | 5,765 | 2,047 | 1,214 | 7,082 | 2,963 | 6,190 | 1,598 | |
| 2 Nov 2014 | 13,015 | 5,188 | 1,731 | 1,041 | 6,525 | 2,697 | 4,759 | 1,450 | |
| 19 Oct 2014 | 9,911 | 4,890 | 1,540 | 926 | 4,665 | 2,705 | 3,706 | 1,259 | |
| 12 Oct 2014 | 8,950 | 4,476 | 1,472 | 843 | 4,249 | 2,458 | 3,252 | 1,183 | |
| 28 Sep 2014 | 7,169 | 3,278 | 1,157 | 710 | 3,696 | 1,998 | 2,317 | 570 | |
| 14 Sep 2014 | 5,327 | 2,578 | 942 | 601 | 2,720 | 1,461 | 1,655 | 516 | |
| 31 Aug 2014 | 3,664 | 1,794 | 771 | 494 | 1,698 | 871 | 1,216 | 436 | |
| 16 Aug 2014 | 2,225 | 1,225 | 543 | 394 | 834 | 466 | 848 | 365 | |
| 9 Aug 2014 | 1,835 | 1,011 | 506 | 373 | 599 | 323 | 730 | 315 | |
| 30 Jul 2014 | 1,437 | 825 | 472 | 346 | 391 | 227 | 574 | 252 | |
| 23 Jul 2014 | 1,201 | 672 | 427 | 319 | 249 | 129 | 525 | 224 | |
| 14 Jul 2014 | 982 | 613 | 411 | 310 | 174 | 106 | 397 | 197 | |
| 2 Jul 2014 | 779 | 481 | 412 | 305 | 115 | 75 | 252 | 101 | |
| 17 Jun 2014 | 528 | 337 | 398 | 264 | 33 | 24 | 97 | 49 | |
| 27 May 2014 | 309 | 202 | 281 | 186 | 12 | 11 | 16 | 5 | |
| 12 May 2014 | 260 | 182 | 248 | 171 | 12 | 11 | – | – | |
| 1 May 2014 | 239 | 160 | 226 | 149 | 13 | 11 | – | – | |
| 14 Apr 2014 | 176 | 110 | 168 | 108 | 8 | 2 | – | – | |
| 31 Mar 2014 | 130 | 82 | 122 | 80 | 8 | 2 | – | – | |
| 22 Mar 2014 | 49 | 29 | 49 | 29 | – | – | – | – | |
| Date | Total |
|
|
|
|
|
|
|
Refs | ||||||||
|---|---|---|---|---|---|---|---|---|---|---|---|---|---|---|---|---|---|
| Cases | Deaths | Cases | Deaths | Cases | Deaths | Cases | Deaths | Cases | Deaths | Cases | Deaths | Cases | Deaths | Cases | Deaths | ||
| 4 Nov 2015 | 36 | 15 | 20 | 8 | 1 | 0 | 4 | 1 | 1 | 0 | 8 | 6 | 1 | 0 | 1 | 0 | |
| 13 May 2015 | 36 | 15 | 20 | 8 | 1 | 0 | 4 | 1 | 1 | 0 | 8 | 6 | 1 | 0 | 1 | 0 | |
| 29 Dec 2014 | 35 | 15 | 20 | 8 | 1 | 0 | 4 | 1 | 1 | 0 | 8 | 6 | 1 | 0 | – | – | |
| 14 Dec 2014 | 32 | 15 | 20 | 8 | 1 | 0 | 4 | 1 | 1 | 0 | 6 | 6 | – | – | – | – | |
| 2 Nov 2014 | 27 | 10 | 20 | 8 | 1 | 0 | 4 | 1 | 1 | 0 | 1 | 1 | – | – | – | – | |
| 19 Oct 2014 | 25 | 9 | 20 | 8 | 1 | 0 | 3 | 1 | 1 | 0 | - | – | – | – | – | – | |
| 12 Oct 2014 | 23 | 8 | 20 | 8 | 1 | 0 | 1 | 0 | 1 | 0 | - | – | – | – | – | – | |
| 28 Sep 2014 | 22 | 8 | 20 | 8 | 1 | 0 | 1 | 0 | - | – | - | – | – | – | – | – | |
| 31 Aug 2014 | 22 | 7 | 21 | 7 | 1 | 0 | – | – | - | – | - | – | – | – | – | – | |
| 16 Aug 2014 | 15 | 4 | 15 | 4 | – | – | - | – | - | – | - | – | – | – | – | – | |
| 9 Aug 2014 | 13 | 2 | 13 | 2 | – | – | - | – | - | – | – | – | – | – | – | – | |
| 30 Jul 2014 | 3 | 1 | 3 | 1 | – | – | – | – | - | – | – | – | – | – | – | – | |
Notes:
- Date is the "as of" date from the reference. A single source may report statistics for multiple "as of" dates.
- Total cases and deaths before 1 July 2014 are calculated.
- Numbers with ≥ may not be consistent due to under reporting.
Further reading
- Guo, Zuiyuan; Xiao, Dan; Li, Dongli; Wang, Xiuhong; Wang, Yayu; Yan, Tiecheng; Wang, Zhiqi (6 April 2016). "Predicting and Evaluating the Epidemic Trend of Ebola Virus Disease in the 2014-2015 Outbreak and the Effects of Intervention Measures". PLOS ONE. 11 (4): e0152438. Bibcode:2016PLoSO..1152438G. doi:10.1371/journal.pone.0152438. ISSN 1932-6203. PMC 4822846. PMID 27049322.
- Tuite, Ashleigh R.; Fisman, David N. (September 2016). "The IDEA model: A single equation approach to the Ebola forecasting challenge". Epidemics. 22: 71–77. doi:10.1016/j.epidem.2016.09.001. PMID 27717616.
External links
- "Ebola response roadmap – Situation reports". WHO. Archived from the original on December 17, 2014. Retrieved 11 April 2015.
- "Outbreak Updates". World Health Organization (WHO). Archived from the original on 24 April 2015. Retrieved 11 April 2015.
- "Outbreak Updates". US Centers for Disease Control and Prevention (CDC). Retrieved 11 April 2015.
- "Ebola Outbreak in West Africa Updates". Food and Agriculture Organization of the UN (FAO). Retrieved 11 April 2015.
- "2014 Ebola Outbreak – detail timeline and projection". healthmap.org. Retrieved 11 April 2015.
- "Platform to share communication materials regarding the Ebola epidemic". Ebola Communication Network. Retrieved 11 April 2015.
- "Fighting Ebola: A Grand Challenge for Development – Platform to collect and distribute ideas to stop the Ebola epidemic". USAID. Archived from the original on 4 January 2016. Retrieved 11 April 2015.
- "Ebola outbreak in West Africa". European Centre for Disease Prevention and Control (ECDC). Retrieved 11 April 2015.
- "Ebolafacts – a simple FAQ in English & French". Retrieved 11 April 2015.
Resources
| Ebolavirus |
|
||||||||||||||
|---|---|---|---|---|---|---|---|---|---|---|---|---|---|---|---|
| Marburgvirus |
|
||||||||||||||
| Cuevavirus |
|
||||||||||||||
| Dianlovirus |
|
||||||||||||||
| Striavirus |
|
||||||||||||||
| Thamnovirus |
|
||||||||||||||