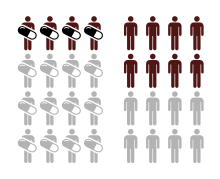
The group exposed to treatment (left) has the risk of an adverse outcome (black) reduced by 50% (RRR = 0.5) compared to the unexposed group (right).
In epidemiology, the relative risk reduction (RRR) or efficacy is the relative decrease in the risk of an adverse event in the exposed group compared to an unexposed group. It is computed as  , where
  is the incidence in the exposed group, and
  is the incidence in the unexposed group. If the risk of an adverse event is increased by the exposure rather than decreased, the term relative risk increase (RRI) is used, and it is computed as
  . If the direction of risk change is not assumed, the term relative effect is used, and it is computed in the same way as relative risk increase.
Numerical examples
Risk reduction
Example of risk reduction
| Quantity
|
Experimental group (E)
|
Control group (C)
|
Total
|
| Events (E)
|
EE = 15
|
CE = 100
|
115
|
| Non-events (N)
|
EN = 135
|
CN = 150
|
285
|
| Total subjects (S)
|
ES = EE + EN = 150
|
CS = CE + CN = 250
|
400
|
| Event rate (ER)
|
EER = EE / ES = 0.1, or 10%
|
CER = CE / CS = 0.4, or 40%
|
—
|
Risk increase
Example of risk increase
| Quantity
|
Experimental group (E)
|
Control group (C)
|
Total
|
| Events (E)
|
EE = 75
|
CE = 100
|
175
|
| Non-events (N)
|
EN = 75
|
CN = 150
|
225
|
| Total subjects (S)
|
ES = EE + EN = 150
|
CS = CE + CN = 250
|
400
|
| Event rate (ER)
|
EER = EE / ES = 0.5, or 50%
|
CER = CE / CS = 0.4, or 40%
|
—
|
See also


