
 A flow cytometer tube with suction straw
| |
| Classification | Cytometry |
|---|---|
| Analytes | Cells or particles |
| Other techniques | |
| Related | Coulter counter |
Flow cytometry (FC) is a technique used to detect and measure physical and chemical characteristics of a population of cells or particles.
In this process, a sample containing cells or particles is suspended in a fluid and injected into the flow cytometer instrument. The sample is focused to ideally flow one cell at a time through a laser beam, where the light scattered is characteristic to the cells and their components. Cells are often labeled with fluorescent markers so light is absorbed and then emitted in a band of wavelengths. Tens of thousands of cells can be quickly examined and the data gathered are processed by a computer.
Flow cytometry is routinely used in basic research, clinical practice, and clinical trials. Uses for flow cytometry include:
- Cell counting
- Cell sorting
- Determining cell characteristics and function
- Detecting microorganisms
- Biomarker detection
- Protein engineering detection
- Diagnosis of health disorders such as blood cancers
- Measuring genome size
A flow cytometry analyzer is an instrument that provides quantifiable data from a sample. Other instruments using flow cytometry include cell sorters which physically separate and thereby purify cells of interest based on their optical properties.
History
The first impedance-based flow cytometry device, using the Coulter principle, was disclosed in U.S. Patent 2,656,508, issued in 1953, to Wallace H. Coulter. Mack Fulwyler was the inventor of the forerunner to today's flow cytometers - particularly the cell sorter. Fulwyler developed this in 1965 with his publication in Science. The first fluorescence-based flow cytometry device (ICP 11) was developed in 1968 by Wolfgang Göhde from the University of Münster, filed for patent on 18 December 1968 and first commercialized in 1968/69 by German developer and manufacturer Partec through Phywe AG in Göttingen. At that time, absorption methods were still widely favored by other scientists over fluorescence methods. Soon after, flow cytometry instruments were developed, including the Cytofluorograph (1971) from Bio/Physics Systems Inc. (later: Ortho Diagnostics), the PAS 8000 (1973) from Partec, the first FACS (fluorescence-activated cell sorting) instrument from Becton Dickinson (1974), the ICP 22 (1975) from Partec/Phywe and the Epics from Coulter (1977/78). The first label-free high-frequency impedance flow cytometer based on a patented microfluidic "lab-on-chip", Ampha Z30, was introduced by Amphasys (2012).
Name of the technology
The original name of the fluorescence-based flow cytometry technology was "pulse cytophotometry" (German: Impulszytophotometrie), based on the first patent application on fluorescence-based flow cytometry. At the 5th American Engineering Foundation Conference on Automated Cytology in Pensacola (Florida) in 1976 - eight years after the introduction of the first fluorescence-based flow cytometer (1968) - it was agreed to commonly use the name "flow cytometry", a term that quickly became popular.
Flow cytometers
Modern flow cytometers are able to analyze many thousands of particles per second, in "real time" and, if configured as cell sorters, can actively separate and isolate particles with specified optical properties at similar rates. A flow cytometer is similar to a microscope, except that, instead of producing an image of the cell, flow cytometry offers high-throughput, automated quantification of specified optical parameters on a cell-by-cell basis. To analyze solid tissues, a single-cell suspension must first be prepared.
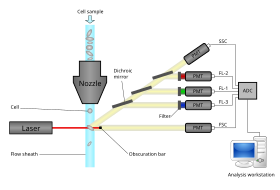
A flow cytometer has five main components: a flow cell, a measuring system, a detector, an amplification system, and a computer for analysis of the signals. The flow cell has a liquid stream (sheath fluid), which carries and aligns the cells so that they pass single file through the light beam for sensing. The measuring system commonly uses measurement of impedance (or conductivity) and optical systems - lamps (mercury, xenon); high-power water-cooled lasers (argon, krypton, dye laser); low-power air-cooled lasers (argon (488 nm), red-HeNe (633 nm), green-HeNe, HeCd (UV)); diode lasers (blue, green, red, violet) resulting in light signals. The detector and analog-to-digital conversion (ADC) system converts analog measurements of forward-scattered light (FSC) and side-scattered light (SSC) as well as dye-specific fluorescence signals into digital signals that can be processed by a computer. The amplification system can be linear or logarithmic.
The process of collecting data from samples using the flow cytometer is termed "acquisition". Acquisition is mediated by a computer physically connected to the flow cytometer, and the software which handles the digital interface with the cytometer. The software is capable of adjusting parameters (e.g., voltage, compensation) for the sample being tested, and also assists in displaying initial sample information while acquiring sample data to ensure that parameters are set correctly. Early flow cytometers were, in general, experimental devices, but technological advances have enabled widespread applications for use in a variety of both clinical and research purposes. Due to these developments, a considerable market for instrumentation, analysis software, as well as the reagents used in acquisition such as fluorescently labeled antibodies have been developed.
Modern instruments usually have multiple lasers and fluorescence detectors. The current record for a commercial instrument is ten lasers and 30 fluorescence detectors. Increasing the number of lasers and detectors allows for multiple antibody labeling, and can more precisely identify a target population by their phenotypic markers. Certain instruments can even take digital images of individual cells, allowing for the analysis of fluorescent signal location within or on the surface of cells.
Hardware
Fluidics system of a flow cytometer
Cells must pass uniformly through the center of focused laser beams to accurately measure optical properties of cells in any flow cytometer. The purpose of the fluidic system is to move the cells one by one through the lasers beam and throughout the instrument. Fluidics in a flow cytometer with cell sorting capabilities also use the stream to carry sorted cells into collection tubes or wells.
Hydrodynamic focusing
For precise positioning of cells in a liquid jet, hydrodynamic focusing is used in most cytometers. The cells in suspension enter into the instrument enclosed by an outer sheath fluid. The sample core is maintained in the center of the sheath fluid. The sample input rate or how fast the cells flow through to the laser interrogation can be controlled by the pressure of the sheath fluid on the sample core. Under optimal conditions, the central fluid stream and sheath fluid do not mix.
Acoustic-assisted hydrodynamic focusing
Acoustic focusing technology is used in some flow cytometers to support hydrodynamic focusing. Acoustic waves (>2 MHz) pre-focus the sample before introduction to sheath fluid. The pre-focused sample is then injected into the hydrodynamic core and flowed through the instrument. This may help with increasing data accuracy under high sample input rates.
Optics and electronics
Optical filters
Light emitted from fluorophores are in a spectrum of wavelengths, so combining multiple fluorophores may cause overlap. To add specificity, optical filters and dichroic mirrors are used to filter and move light to the detectors such as photomultiplier tubes (PMTs) or avalanche photodiodes (APD). Optical filters are designed as band pass (BP), long pass (LP), or short pass (SP) filters. Most flow cytometers uses dichroic mirrors and band pass filters to select specific bands of the optical spectrum.
Prisms, gratings, and spectral flow cytometry
Spectral flow cytometry uses prisms or diffraction gratings to disperse the emitted light of a marker across a detector array. This allows for the full spectra from each particle to be measured. The measured spectra from single cells are subsequently unmixed by using reference spectra of all used dyes and the autofluorescence spectrum. This may allow for a wider panel design and the application of new biological markers.
Imaging flow cytometry
Imaging flow cytometry (IFC) captures multichannel images of cells. Detectors used in imaging platforms can be equipped with charge-coupled device (CCD) or complementary metal–oxide–semiconductor (CMOS) to capture images of individual cells.
Data analysis
Compensation
Each fluorochrome has a broad fluorescence spectrum. When more than one fluorochrome is used, the overlap between fluorochromes can occur. This situation is called spectrum overlap. This situation needs to be overcome. For example, the emission spectrum for FITC and PE is that the light emitted by the fluorescein overlaps the same wavelength as it passes through the filter used for PE. This spectral overlap is corrected by removing a portion of the FITC signal from the PE signals or vice versa. This process is called color compensation, which calculates a fluorochrome as a percentage to measure itself.
Compensation is the mathematical process by which spectral overlap of multiparameter flow cytometric data is corrected. Since fluorochromes can have wide-ranging spectrum, they can overlap, causing the undesirable result of confusion during the analysis of data. This overlap, known as spillover and quantified in the spillover coefficient, is usually caused by detectors for a certain fluorochrome measuring a significant peak in wavelength from a different fluorochrome. Linear algebra is most often used to make this correction.
In general, when graphs of one or more parameters are displayed, it is to show that the other parameters do not contribute to the distribution shown. Especially when using the parameters which are more than double, this problem is more severe. Currently, no tools have been discovered to efficiently display multidimensional parameters. Compensation is very important to see the distinction between cells.
Gating
The data generated by flow cytometers can be plotted in a single dimension, to produce a histogram, or in two-dimensional dot plots, or even in three dimensions. The regions on these plots can be sequentially separated, based on fluorescence intensity, by creating a series of subset extractions, termed "gates." Specific gating protocols exist for diagnostic and clinical purposes, especially in relation to hematology. Individual single cells are often distinguished from cell doublets or higher aggregates by their "time-of-flight" (denoted also as a "pulse-width") through the narrowly focused laser beam
The plots are often made on logarithmic scales. Because different fluorescent dyes' emission spectra overlap, signals at the detectors have to be compensated electronically as well as computationally. Data accumulated using the flow cytometer can be analyzed using software. Once the data is collected, there is no need to stay connected to the flow cytometer and analysis is most often performed on a separate computer. This is especially necessary in core facilities where usage of these machines is in high demand.
Computational analysis
Recent progress on automated population identification using computational methods has offered an alternative to traditional gating strategies. Automated identification systems could potentially help findings of rare and hidden populations. Representative automated methods include FLOCK in Immunology Database and Analysis Portal (ImmPort), SamSPECTRAL and flowClust in Bioconductor, and FLAME in GenePattern. T-Distributed Stochastic Neighbor Embedding (tSNE) is an algorithm designed to perform dimensionality reduction, to allow visualization of complex multi-dimensional data in a two-dimensional "map". Collaborative efforts have resulted in an open project called FlowCAP (Flow Cytometry: Critical Assessment of Population Identification Methods,) to provide an objective way to compare and evaluate the flow cytometry data clustering methods, and also to establish guidance about appropriate use and application of these methods.
FMO controls
Fluorescence minus one (FMO) controls are important for data interpretation when building multi-color panels - in which a cell is stained with multiple fluorochromes simultaneously. FMO controls provide a measure of fluorescence spillover in a given channel and allow for compensation. To generate a FMO control, a sample is stained with all the fluorochromes except the one that is being tested - meaning if you are using 4 different fluorochromes your FMO control must contain only 3 of them (example: fluorochromes - A, B, C, D; FMOs - ABC_, AB_D, A_CD, _BCD).
Cell sorting by flow cytometry
Cell sorting is a method to purify cell populations based on the presence or absence of specific physical characteristics. In flow cytometers with sorting capabilities, the instrument detects cells using parameters including cell size, morphology, and protein expression, and then droplet technology to sort cells and recover the subsets for post-experimental use.
The first prototype sorter was built at the Los Alamos National Laboratory (LANL) in 1965 by physicist Mack J. Fulwyler by joining a Coulter volume sensor with the newly invented ink jet printer. Live cell cell sorter or fluorescence-activated cell sorter (FACS) was generated by Len Herzenberg, who subsequently won the Kyoto Prize in 2006 for his seminal work.
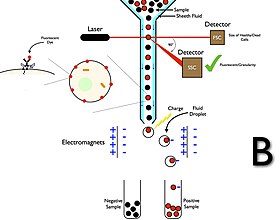
Flow cytometry cell sorters have a collection system unlike flow cytometry analyzers. The collection process starts when a sample is injected into a stream of sheath fluid that passes through the flow cell and laser intercepts. The stream then carries the cell through a vibrating nozzle which generates droplets with most containing either one cell or no cells. An electrical charging ring is placed just at the point where the stream breaks into droplets and a charge is placed on the ring based immediately prior to fluorescence intensity being measured; the opposite charge is trapped on the droplet as it breaks from the stream and the droplets are therefore charged. The charged droplets then fall through an electrostatic deflection system that diverts droplets into containers based on their charge. In some systems, the charge is applied directly to the stream, and the droplet breaking off retains charge of the same sign as the stream. The stream is then returned to neutral after the droplet breaks off. After collecting, these cells can be further cultured, manipulated, and studied.
Labels

Flow cytometry uses the light properties scattered from cells or particles for identification or quantitative measurement of physical properties. Labels, dyes, and stains can be used for multi-parametric analysis (understand more properties about a cell). Immunophenotyping is the analysis of heterogeneous populations of cells using labeled antibodies and other fluorophore containing reagents such as dyes and stains.
Fluorescent labels
A wide range of fluorophores can be used as labels in flow cytometry. Fluorophores, or simply "fluors", are typically attached to an antibody that recognizes a target feature on or in the cell; they may also be attached to a chemical entity with affinity for the cell membrane or another cellular structure. Each fluorophore has a characteristic peak excitation and emission wavelength, and the emission spectra often overlap. Consequently, the combination of labels which can be used depends on the wavelength of the lamp(s) or laser(s) used to excite the fluorochromes and on the detectors available. The maximum number of distinguishable fluorescent labels is thought to be 17 or 18, and this level of complexity necessitates laborious optimization to limit artifacts, as well as complex deconvolution algorithms to separate overlapping spectra. Flow cytometry uses fluorescence as a quantitative tool; the utmost sensitivity of flow cytometry is unmatched by other fluorescent detection platforms such as confocal microscopy. Absolute fluorescence sensitivity is generally lower in confocal microscopy because out-of-focus signals are rejected by the confocal optical system and because the image is built up serially from individual measurements at every location across the cell, reducing the amount of time available to collect signal.
Quantum dots
Quantum dots are sometimes used in place of traditional fluorophores because of their narrower emission peaks.
Isotope labeling
Mass cytometry overcomes the fluorescent labeling limit by utilizing lanthanide isotopes attached to antibodies. This method could theoretically allow the use of 40 to 60 distinguishable labels and has been demonstrated for 30 labels. Mass cytometry is fundamentally different from flow cytometry: cells are introduced into a plasma, ionized, and associated isotopes are quantified via time-of-flight mass spectrometry. Although this method permits the use of a large number of labels, it currently has lower throughput capacity than flow cytometry. It also destroys the analysed cells, precluding their recovery by sorting.
Cytometric bead array
In addition to the ability to label and identify individual cells via fluorescent antibodies, cellular products such as cytokines, proteins, and other factors may be measured as well. Similar to ELISA sandwich assays, cytometric bead array (CBA) assays use multiple bead populations typically differentiated by size and different levels of fluorescence intensity to distinguish multiple analytes in a single assay. The amount of the analyte captured is detected via a biotinylated antibody against a secondary epitope of the protein, followed by a streptavidin-R-phycoerythrin treatment. The fluorescent intensity of R-phycoerythrin on the beads is quantified on a flow cytometer equipped with a 488 nm excitation source. Concentrations of a protein of interest in the samples can be obtained by comparing the fluorescent signals to those of a standard curve generated from a serial dilution of a known concentration of the analyte. Commonly also referred to as cytokine bead array (CBA).
Impedance flow cytometry
Impedance-based single cell analysis systems are commonly known as Coulter counters. They represent a well-established method for counting and sizing virtually any kind of cells and particles. The label-free technology has recently been enhanced by a "lab-on-a-chip" based approach and by applying high frequency alternating current (AC) in the radio frequency range (from 100 kHz to 30 MHz) instead of a static direct current (DC) or low frequency AC field. This patented technology allows a highly accurate cell analysis and provides additional information like membrane capacitance and viability. The relatively small size and robustness allow battery powered on-site use in the field.
Measurable parameters
- Apoptosis (quantification, measurement of DNA degradation, mitochondrial membrane potential, permeability changes, caspase activity)
- Cell adherence (for instance, pathogen-host cell adherence)
- Cell pigments such as chlorophyll or phycoerythrin
- Cell surface antigens (Cluster of differentiation (CD) markers)
- Cell viability
- Circulating tumor cells: isolation and purification
- Characterising multidrug resistance (MDR) in cancer cells
- Chromosome analysis and sorting (library construction, chromosome paint)
- DNA copy number variation (by Flow-FISH or BACs-on-Beads technology)
- Enzymatic activity
- Glutathione
- Intracellular antigens (various cytokines, secondary mediators, etc.)
- Membrane fluidity
- Monitoring electropermeabilization of cells
- Nuclear antigens
- Oxidative burst
- pH, intracellular ionized calcium, magnesium, membrane potential
- Protein expression and localization
- Protein modifications, phospho-proteins
- Scattering of light can be used to measure volume (by forward scatter) and morphological complexity (by side scatter) of cells or other particles, even those that are non-fluorescent. These are conventionally abbreviated as FSC and SSC respectively.
- Total DNA content (cell cycle analysis, cell kinetics, proliferation, ploidy, aneuploidy, endoreduplication, etc.)
- Total RNA content
- Transgenic products in vivo, particularly the green fluorescent protein or related fluorescent proteins
- Various combinations (DNA/surface antigens, etc.)
Applications
The technology has applications in a number of fields, including molecular biology, pathology, immunology, virology,plant biology and marine biology. It has broad application in medicine especially in transplantation, hematology, tumor immunology and chemotherapy, prenatal diagnosis, genetics and sperm sorting for sex preselection. Flow cytometry is widely applied to detect sperm cells abnormality associated with DNA fragmentation in male fertility assays. Also, it is extensively used in research for the detection of DNA damage, caspase cleavage and apoptosis. Photoacoustic flow cytometry is used in the study of multi-drug-resistant bacteria (most commonly MRSA) to detect, differentiate, and quantify bacteria in the blood marked with dyed bacteriophages. In neuroscience, co-expression of cell surface and intracellular antigens can also be analyzed. In microbiology, it can be used to screen and sort transposon mutant libraries constructed with a GFP-encoding transposon (TnMHA), or to assess viability. In protein engineering, flow cytometry is used in conjunction with yeast display and bacterial display to identify cell surface-displayed protein variants with desired properties. The main advantages of flow cytometry over histology and IHC is the possibility to precisely measure the quantities of antigens and the possibility to stain each cell with multiple antibodies-fluorophores, in current laboratories around 10 antibodies can be bound to each cell. This is much less than mass cytometer where up to 40 can be currently measured, but at a higher price and a slower pace.
Aquatic research
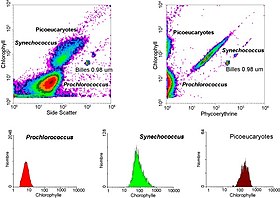
In aquatic systems, flow cytometry is used for the analysis of autofluorescing cells or cells that are fluorescently-labeled with added stains. This research started in 1981 when Clarice Yentsch used flow cytometry to measure the fluorescence in a red tide producing dinoflagellate. The next year researchers published flow cytometric measurements of multiple algal species which could be distinguished based on their fluorescence characteristics. By 1983, marine researchers were assembling their own flow cytometers or using commercially available flow cytometers on seawater samples collected off Bermuda to demonstrate that phytoplankton cells could be distinguished from non-living material and that cyanobacteria could be sorted from a mixed community and subsequently cultured in the lab. Flow cytometry also allowed marine researchers to distinguish between dimly-fluorescing Prochlorococcus and heterotrophic microorganisms, a distinction that is difficult with microscopy-based assessments. Advances in technology now allow aquatic scientists to use flow cytometers continuously during research cruises and flow cytometers are used to provide images of individual phytoplankton cells. Marine scientists use the sorting ability of flow cytometers to make discrete measurements of cellular activity and diversity, to conduct investigations into the mutualistic relationships between microorganisms that live in close proximity, and to measure biogeochemical rates of multiple processes in the ocean.
Cell proliferation assay
Cell proliferation is the major function in the immune system. Often it is required to analyse the proliferative nature of the cells in order to make some conclusions. One such assay to determine the cell proliferation is the tracking dye carboxyfluorescein diacetate succinimidyl ester (CFSE). It helps to monitor proliferative cells. This assay gives quantitative as well as qualitative data during time-series experiments. This dye binds covalently with the long-lived molecules present inside the cell. When the cells divide, the molecules divide too and, the daughter cells possess half the dye than the parent population. This decrease in the intensity can be visualized by flow cytometry. In literature, this powerful technique of flow cytometry and CFSE has been used to find the efficiency of T-cells in killing the target cells in cancer such as leukemia. In order to visualize the target cell death, both rapid and slow, scientists have used CFSE labelling with antibody staining of certain kinds of cells and fluorescently labelled microbeads. This also gave information regarding the proliferation of the target cells upon the treatment of certain cytokines.
Measuring genome size
Flow cytometry has been used to measure genome sizes, or more precisely: the amount of DNA in a cell or nucleus. Although genomes can be analyzed with more precision by genome sequencing, this is often difficult due to a high fraction of micro-chromosomes or repetitive sequences which may be missed by sequencing (or which get filtered out during the analysis step when they cannot be assigned to chromosomes). However, flow cytometry is not perfect either. The resulting genome sizes may differ based on the dye used. An analysis of fish genomes resulted in significantly different genome sizes when propidium iodide (PI) and DAPI were used, respectively. For instance, the genome of Anguilla japonica was found to contain 1.09 pg of DNA with PI vs. 1.25 pg with DAPI. Similarly, the genome of Myxocyprinus asiaticus was found to contain 2.75 pg of DNA (PI) vs. 3.08 pg (DAPI). That is, the differences were on the order of 12-14%.
See also
- Tissue Cytometry, a technique that brings the concept of flow cytometry to tissue section, in situ, and helps to perform quantification of markers by maintaining the spatial context.
- Annexin A5 affinity assay, a test for cells undergoing apoptosis, often uses flow cytometry
- Cell cycle analysis
- Coulter counter
- Cytometry
- Dielectrophoresis
- Flow Cytometry Standard
- Mass cytometry
- Microfluorimetry
- Viability assay
Further reading
- Carey JL, McCoy Jr JP, Keren DF (2007). Flow cytometry in clinical diagnosis (4th ed.). Chicago, IL: American Society for Clinical Pathology (ASCP) Press. ISBN 978-0-89189-548-0.
- Darzynkiewicz Z, Roederer M, Tanke HJ, eds. (2004). Methods in Cell Biology, Cytometry. Vol. 75 (4th ed.). Elsevier /Academic Press. ISBN 0-12-480283-4.
- Darzynkiewicz Z, Robinson JP, Roederer M (2009). Essential cytometry methods (1st ed.). Amsterdam: Elsevier/Academic Press. ISBN 978-0-12-375045-7.
- Darzynkiewicz Z, et al., eds. (2011). Recent Advances in Cytometry. Part A. Methods in Cell Biology. Vol. 102. Elsevier/Academic Press. ISBN 978-0-12-374912-3.
- Darzynkiewicz Z, et al., eds. (2011). Recent Advances in Cytometry. Part B. Methods in Cell Biology. Vol. 103. Elsevier/Academic Press. ISBN 978-0-12-385493-3.
- Lloyd D (1993). Flow cytometry in microbiology. London: Springer-Verlag. ISBN 978-3-540-19796-6.
- Ormerod MG (1999). Flow cytometry (2nd ed.). Oxford, UK: Bios Scientific Publishers. ISBN 978-1-85996-107-0.
- Ormerod MG, ed. (2000). Flow cytometry : a practical approach (3rd ed.). Oxford [England]: Oxford University Press. ISBN 978-0-19-963824-6.
- Ormerod MG (2008). Flow cytometry : a basic introduction. Redhill: M.G. Ormerod. ISBN 978-0-9559812-0-3.
- Robinson JP, et al. (1993). Handbook of flow cytometry methods. New York: Wiley-Liss. ISBN 978-0-471-59634-9.
- Shapiro HM (2003). Practical flow cytometry (4th ed.). New York: Wiley-Liss. ISBN 978-0-471-41125-3.
- Sklar LA (2005). Flow cytometry for biotechnology. New York: Oxford University Press. ISBN 978-0-19-515234-0.
External links
|
Library resources about Flow cytometry |
-
 Media related to Flow cytometry at Wikimedia Commons
 - Flow+cytometry at the U.S. National Library of Medicine Medical Subject Headings (MeSH)
| History |  |
||||
|---|---|---|---|---|---|
| Branches | |||||
| Biological concepts | |||||
| General concepts | |||||
| Basic techniques and tools |
|
||||
| Applications | |||||
| Interdisciplinary fields |
|||||
| Lists | |||||