
In genomics, a genome-wide association study (GWA study, or GWAS), is an observational study of a genome-wide set of genetic variants in different individuals to see if any variant is associated with a trait. GWA studies typically focus on associations between single-nucleotide polymorphisms (SNPs) and traits like major human diseases, but can equally be applied to any other genetic variants and any other organisms.
When applied to human data, GWA studies compare the DNA of participants having varying phenotypes for a particular trait or disease. These participants may be people with a disease (cases) and similar people without the disease (controls), or they may be people with different phenotypes for a particular trait, for example blood pressure. This approach is known as phenotype-first, in which the participants are classified first by their clinical manifestation(s), as opposed to genotype-first. Each person gives a sample of DNA, from which millions of genetic variants are read using SNP arrays. If there is significant statistical evidence that one type of the variant (one allele) is more frequent in people with the disease, the variant is said to be associated with the disease. The associated SNPs are then considered to mark a region of the human genome that may influence the risk of disease.
GWA studies investigate the entire genome, in contrast to methods that specifically test a small number of pre-specified genetic regions. Hence, GWAS is a non-candidate-driven approach, in contrast to gene-specific candidate-driven studies. GWA studies identify SNPs and other variants in DNA associated with a disease, but they cannot on their own specify which genes are causal.
The first successful GWAS published in 2002 studied myocardial infarction. This study design was then implemented in the landmark GWA 2005 study investigating patients with age-related macular degeneration, and found two SNPs with significantly altered allele frequency compared to healthy controls. As of 2017, over 3,000 human GWA studies have examined over 1,800 diseases and traits, and thousands of SNP associations have been found. Except in the case of rare genetic diseases, these associations are very weak, but while they may not explain much of the risk, they provide insight into genes and pathways that can be important.
Background

Any two human genomes differ in millions of different ways. There are small variations in the individual nucleotides of the genomes (SNPs) as well as many larger variations, such as deletions, insertions and copy number variations. Any of these may cause alterations in an individual's traits, or phenotype, which can be anything from disease risk to physical properties such as height. Around the year 2000, prior to the introduction of GWA studies, the primary method of investigation was through inheritance studies of genetic linkage in families. This approach had proven highly useful towards single gene disorders. However, for common and complex diseases the results of genetic linkage studies proved hard to reproduce. A suggested alternative to linkage studies was the genetic association study. This study type asks if the allele of a genetic variant is found more often than expected in individuals with the phenotype of interest (e.g. with the disease being studied). Early calculations on statistical power indicated that this approach could be better than linkage studies at detecting weak genetic effects.
In addition to the conceptual framework several additional factors enabled the GWA studies. One was the advent of biobanks, which are repositories of human genetic material that greatly reduced the cost and difficulty of collecting sufficient numbers of biological specimens for study. Another was the International HapMap Project, which, from 2003 identified a majority of the common SNPs interrogated in a GWA study. The haploblock structure identified by HapMap project also allowed the focus on the subset of SNPs that would describe most of the variation. Also the development of the methods to genotype all these SNPs using genotyping arrays was an important prerequisite.
Methods
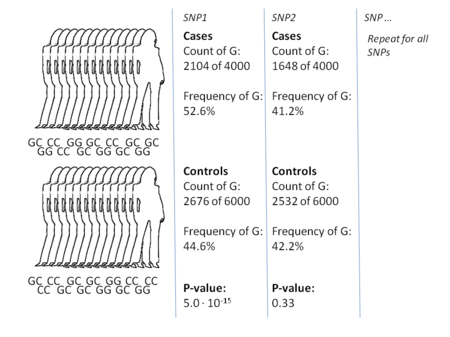

The most common approach of GWA studies is the case-control setup, which compares two large groups of individuals, one healthy control group and one case group affected by a disease. All individuals in each group are typically genotyped at common known SNPs. The exact number of SNPs depends on the genotyping technology, but are typically one million or more. For each of these SNPs it is then investigated if the allele frequency is significantly altered between the case and the control group. In such setups, the fundamental unit for reporting effect sizes is the odds ratio. The odds ratio is the ratio of two odds, which in the context of GWA studies are the odds of case for individuals having a specific allele and the odds of case for individuals who do not have that same allele.
Example: suppose that there are two alleles, T and C. The number of individuals in the case group having allele T is represented by 'A' and the number of individuals in the control group having allele T is represented by 'B'. Similarly, the number of individuals in the case group having allele C is represented by 'X' and the number of individuals in the control group having allele C is represented by 'Y'. In this case the odds ratio for allele T is A:B (meaning 'A to B', in standard odds terminology) divided by X:Y, which in mathematical notation is simply (A/B)/(X/Y).
When the allele frequency in the case group is much higher than in the control group, the odds ratio is higher than 1, and vice versa for lower allele frequency. Additionally, a P-value for the significance of the odds ratio is typically calculated using a simple chi-squared test. Finding odds ratios that are significantly different from 1 is the objective of the GWA study because this shows that a SNP is associated with disease. Because so many variants are tested, it is standard practice to require the p-value to be lower than 5×10⁻⁸ to consider a variant significant.
Variations on the case-control approach. A common alternative to case-control GWA studies is the analysis of quantitative phenotypic data, e.g. height or biomarker concentrations or even gene expression. Likewise, alternative statistics designed for dominance or recessive penetrance patterns can be used. Calculations are typically done using bioinformatics software such as SNPTEST and PLINK, which also include support for many of these alternative statistics. GWAS focuses on the effect of individual SNPs. However, it is also possible that complex interactions among two or more SNPs (epistasis) might contribute to complex diseases. Due to the potentially exponential number of interactions, detecting statistically significant interactions in GWAS data is both computationally and statistically challenging. This task has been tackled in existing publications that use algorithms inspired from data mining. Moreover, the researchers try to integrate GWA data with other biological data such as protein-protein interaction network to extract more informative results.
A key step in the majority of GWA studies is the imputation of genotypes at SNPs not on the genotype chip used in the study. This process greatly increases the number of SNPs that can be tested for association, increases the power of the study, and facilitates meta-analysis of GWAS across distinct cohorts. Genotype imputation is carried out by statistical methods that impute genotypic data to a set of reference panel of haplotypes, which typically have been densely genotyped using whole-genome sequencing. These methods take advantage of sharing of haplotypes between individuals over short stretches of sequence to impute alleles. Existing software packages for genotype imputation include IMPUTE2, Minimac, Beagle and MaCH.
In addition to the calculation of association, it is common to take into account any variables that could potentially confound the results. Sex and age are common examples of confounding variables. Moreover, it is also known that many genetic variations are associated with the geographical and historical populations in which the mutations first arose. Because of this association, studies must take account of the geographic and ethnic background of participants by controlling for what is called population stratification. If they fail to do so, these studies can produce false positive results.
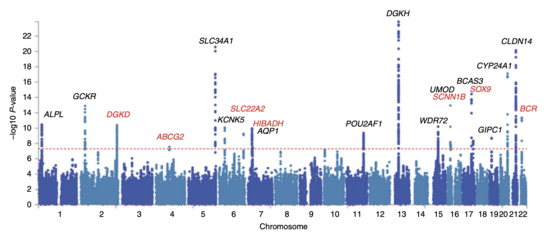
After odds ratios and P-values have been calculated for all SNPs, a common approach is to create a Manhattan plot. In the context of GWA studies, this plot shows the negative logarithm of the P-value as a function of genomic location. Thus the SNPs with the most significant association stand out on the plot, usually as stacks of points because of haploblock structure. Importantly, the P-value threshold for significance is corrected for multiple testing issues. The exact threshold varies by study, but the conventional genome-wide significance threshold is 5×10⁻⁸ to be significant in the face of hundreds of thousands to millions of tested SNPs. GWA studies typically perform the first analysis in a discovery cohort, followed by validation of the most significant SNPs in an independent validation cohort.
Results

Attempts have been made at creating comprehensive catalogues of SNPs that have been identified from GWA studies. As of 2009, SNPs associated with diseases are numbered in the thousands.
The first GWA study, conducted in 2005, compared 96 patients with age-related macular degeneration (ARMD) with 50 healthy controls. It identified two SNPs with significantly altered allele frequency between the two groups. These SNPs were located in the gene encoding complement factor H, which was an unexpected finding in the research of ARMD. The findings from these first GWA studies have subsequently prompted further functional research towards therapeutical manipulation of the complement system in ARMD.
Another landmark publication in the history of GWA studies was the Wellcome Trust Case Control Consortium (WTCCC) study, the largest GWA study ever conducted at the time of its publication in 2007. The WTCCC included 14,000 cases of seven common diseases (~2,000 individuals for each of coronary heart disease, type 1 diabetes, type 2 diabetes, rheumatoid arthritis, Crohn's disease, bipolar disorder, and hypertension) and 3,000 shared controls. This study was successful in uncovering many new disease genes underlying these diseases.
Since these first landmark GWA studies, there have been two general trends. One has been towards larger and larger sample sizes. In 2018, several genome-wide association studies are reaching a total sample size of over 1 million participants, including 1.1 million in a genome-wide study of educational attainment and a study of insomnia containing 1.3 million individuals. The reason is the drive towards reliably detecting risk-SNPs that have smaller effect sizes and lower allele frequency. Another trend has been towards the use of more narrowly defined phenotypes, such as blood lipids, proinsulin or similar biomarkers. These are called intermediate phenotypes, and their analyses may be of value to functional research into biomarkers.
A variation of GWAS uses participants that are first-degree relatives of people with a disease. This type of study has been named genome-wide association study by proxy (GWAX).
A central point of debate on GWA studies has been that most of the SNP variations found by GWA studies are associated with only a small increased risk of the disease, and have only a small predictive value. The median odds ratio is 1.33 per risk-SNP, with only a few showing odds ratios above 3.0. These magnitudes are considered small because they do not explain much of the heritable variation. This heritable variation is estimated from heritability studies based on monozygotic twins. For example, it is known that 80-90% of variance in height can be explained by hereditary differences, but GWA studies only account for a minority of this variance.
Clinical applications and examples
A challenge for future successful GWA study is to apply the findings in a way that accelerates drug and diagnostics development, including better integration of genetic studies into the drug-development process and a focus on the role of genetic variation in maintaining health as a blueprint for designing new drugs and diagnostics. Several studies have looked into the use of risk-SNP markers as a means of directly improving the accuracy of prognosis. Some have found that the accuracy of prognosis improves, while others report only minor benefits from this use. Generally, a problem with this direct approach is the small magnitudes of the effects observed. A small effect ultimately translates into a poor separation of cases and controls and thus only a small improvement of prognosis accuracy. An alternative application is therefore the potential for GWA studies to elucidate pathophysiology.
Hepatitis C treatment
One such success is related to identifying the genetic variant associated with response to anti-hepatitis C virus treatment. For genotype 1 hepatitis C treated with Pegylated interferon-alpha-2a or Pegylated interferon-alpha-2b combined with ribavirin, a GWA study has shown that SNPs near the human IL28B gene, encoding interferon lambda 3, are associated with significant differences in response to the treatment. A later report demonstrated that the same genetic variants are also associated with the natural clearance of the genotype 1 hepatitis C virus. These major findings facilitated the development of personalized medicine and allowed physicians to customize medical decisions based on the patient's genotype.
eQTL, LDL and cardiovascular disease
The goal of elucidating pathophysiology has also led to increased interest in the association between risk-SNPs and the gene expression of nearby genes, the so-called expression quantitative trait loci (eQTL) studies. The reason is that GWAS studies identify risk-SNPs, but not risk-genes, and specification of genes is one step closer towards actionable drug targets. As a result, major GWA studies by 2011 typically included extensive eQTL analysis. One of the strongest eQTL effects observed for a GWA-identified risk SNP is the SORT1 locus. Functional follow up studies of this locus using small interfering RNA and gene knock-out mice have shed light on the metabolism of low-density lipoproteins, which have important clinical implications for cardiovascular disease.
Atrial fibrillation
For example, a meta-analysis accomplished in 2018 revealed the discovery of 70 new loci associated with atrial fibrillation. It has been identified different variants associated with transcription factor coding-genes, such as TBX3 and TBX5, NKX2-5 o PITX2, which are involved in cardiac conduction regulation, in ionic channel modulation and cardiac development. It was also identified new genes involved in tachycardia (CASQ2) or associated with alteration of cardiac muscle cell communication (PKP2).
Schizophrenia
Research using a High-Precision Protein Interaction Prediction (HiPPIP) computational model that discovered 504 new protein-protein interactions (PPIs) associated with genes linked to schizophrenia,. While the evidence supporting the genetic basis of schizophrenia is not controversial, one study found that 25 candidate schizophrenia genes discovered from GWAS had little association with schizophrenia, demonstrating that GWAS alone may be insufficient to identify candidate genes.
Conservation applications
Population level GWA studies may be used to identify adaptive genes to help evaluate ability of species to adapt to changing environmental conditions as the global climate becomes warmer. This could help determine extirpation risk for species and could therefore be an important tool for conservation planning. Utilizing GWA studies to determine adaptive genes could help elucidate the relationship between neutral and adaptive genetic diversity.
Agricultural applications
Plant growth stages and yield components
GWA studies act as an important tool in plant breeding. With large genotyping and phenotyping data, GWAS are powerful in analyzing complex inheritance modes of traits that are important yield components such as number of grains per spike, weight of each grain and plant structure. In a study on GWAS in spring wheat, GWAS have revealed a strong correlation of grain production with booting data, biomass and number of grains per spike. GWA study is also a success in study genetic architecture of complex traits in rice.
Plant pathogens
The emergences of plant pathogens have posed serious threats to plant health and biodiversity. Under this consideration, identification of wild types that have the natural resistance to certain pathogens could be of vital importance. Furthermore, we need to predict which alleles are associated with the resistance. GWA studies is a powerful tool to detect the relationships of certain variants and the resistance to the plant pathogen, which is beneficial for developing new pathogen-resisted cultivars.
Chicken
The first GWA study in chickens was done by Abasht and Lamont in 2007. This GWA was used to study the fatness trait in F2 population found previously. Significantly related SNPs were found are on 10 chromosomes (1, 2, 3, 4, 7, 8, 10, 12, 15 and 27).
Limitations
GWA studies have several issues and limitations that can be taken care of through proper quality control and study setup. Lack of well defined case and control groups, insufficient sample size, control for multiple testing and control for population stratification are common problems. Particularly the statistical issue of multiple testing wherein it has been noted that "the GWA approach can be problematic because the massive number of statistical tests performed presents an unprecedented potential for false-positive results". Ignoring these correctible issues has been cited as contributing to a general sense of problems with the GWA methodology. In addition to easily correctible problems such as these, some more subtle but important issues have surfaced. A high-profile GWA study that investigated individuals with very long life spans to identify SNPs associated with longevity is an example of this. The publication came under scrutiny because of a discrepancy between the type of genotyping array in the case and control group, which caused several SNPs to be falsely highlighted as associated with longevity. The study was subsequently retracted, but a modified manuscript was later published.
This points to the general vulnerability of GWA studies based on genotyping arrays, which is the high reliance on array design. Another consequence is that such studies are unable to detect the contribution of very rare mutations not included in the array.
GWA studies also face criticism that the broad variation of individual responses or compensatory mechanisms to a disease state cancel out and mask potential genes or causal variants associated with the disease. Additionally, GWA studies identify candidate risk variants for the population from which their analysis is performed, and with most GWA studies stemming from European databases, there is a lack of translation of the identified risk variants to other non-European populations. Alternative strategies suggested involve linkage analysis. More recently, the rapidly decreasing price of complete genome sequencing have also provided a realistic alternative to genotyping array-based GWA studies. It can be discussed if the use of this new technique is still referred to as a GWA study, but high-throughput sequencing does have potential to side-step some of the shortcomings of non-sequencing GWA.
Fine-mapping
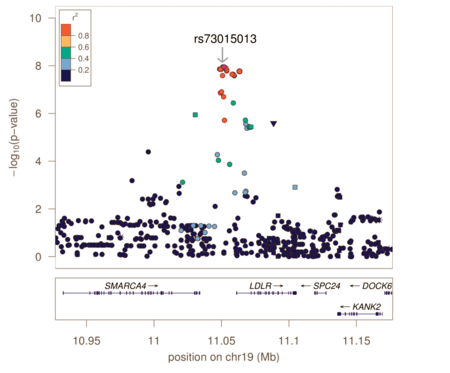
Genotyping arrays designed for GWAS rely on linkage disequilibrium to provide coverage of the entire genome by genotyping a subset of variants. Because of this, the reported associated variants are unlikely to be the actual causal variants. Associated regions can contain hundreds of variants spanning large regions and encompassing many different genes, making the biological interpretation of GWAS loci more difficult. Fine-mapping is a process to refine these lists of associated variants to a credible set most likely to include the causal variant.
Fine-mapping requires all variants in the associated region to have been genotyped or imputed (dense coverage), very stringent quality control resulting in high-quality genotypes, and large sample sizes sufficient in separating out highly correlated signals. There are several different methods to perform fine-mapping, and all methods produce a posterior probability that a variant in that locus is causal. Because the requirements are often difficult to satisfy, there are still limited examples of these methods being more generally applied.
See also
- Association mapping
- Transcriptome-wide association study
- Epidemiology
- Genetic diversity
- Gene–environment interaction
- Genomics
- Linkage disequilibrium
- Molecular epidemiology
- Polygenic score
- Population genetics
- Genetic epidemiology
- Common disease-common variant hypothesis
- Microbiome-wide association study
- Conservation biology
External links
- Genotype-phenotype interaction software tools and databases on omicX
- Statistical Methods for the Analysis of Genome-Wide Association Studies [video lecture series]
- Whole genome association studies — by the National Human Genome Research Institute
- GWAS Central — a central database of summary-level genetic association findings
- Barrett J (18 July 2010). "How to read a genome-wide association study". Genomes Unzipped.
- Consortia of genome-wide association studies (GWAS) Archived 26 February 2018 at the Wayback Machine — by Bennett SN, Caporaso, NE, et al.
- PLINK — whole genome association analysis toolset
- ENCODE threads explorer Impact of functional information on understanding variation. Nature (journal)